Pi Network Price Prediction: Will the PI Bull Run Make Millions Rich?

The post claims the next PI bull run will retire millions of Pioneers, and the claim is spreading fast. Is that realistic? The post offers no data, and PI still trades below both key trend lines.
This Pi Network Price Prediction checks the claim against market data and the daily chart, then lists the levels that matter next.
Market data checked on October 23, 2026. The chart reading is timestamped 15:04 IST.
PI Price Prediction: Market Overview
Metric | Value |
Price (TradingView OKX daily chart) | $0.07975 |
24h Change (CoinMarketCap) | +1.28% |
Daily Candle Change | +1.75% |
Market Cap (CoinMarketCap) | $898.82M |
24h Spot Volume (CoinMarketCap) | $2.96M |
Why is the PI price up today?
Pi's price today is up 1.75% to $0.07975 in 24h, slightly outperforming a flat broader market, primarily driven by modest beta exposure and a minor uptick in altcoin sentiment.
Primary reason: Modest beta exposure to a slightly positive market, amplified by a minor rotation into altcoins as indicated by a rising Altcoin Season Index.
Secondary reasons: the secondary driver was the IMP Support Level $0.07827.
Pi Network News Today: "Next Bull Run" Claim
Pi News posted that the next PI bull run will retire millions of Pioneers, the name Pi Network gives its users.
A bull run is a long stretch of rising prices. The post gives no price target, timeline or data, so it reads as sentiment, not a forecast.
Pi Network Ecosystem Update: 60 Million Engaged Pioneers Cited
A post on X, account not shown, says Pi Network's core team cites 60 million Engaged Pioneers and 300 apps on the PI Mainnet, the live network.
Source: Data From X
CoinGabbar could not verify either figure, since both are project-reported. As a rough ratio, the tracker's $898.82M market cap is about $15 per engaged Pioneer.
PI News: PI Trading Volume Stays Thin
CoinMarketCap shows 24-hour PI spot volume of $2.96M, down 9.99%, against the $898.82M market cap. That is a volume-to-market-cap ratio of 0.3248%, so little of the supply changed hands. Thin volume can make price moves less reliable.
PI Technical Analysis: PI Breaks Its Falling Channel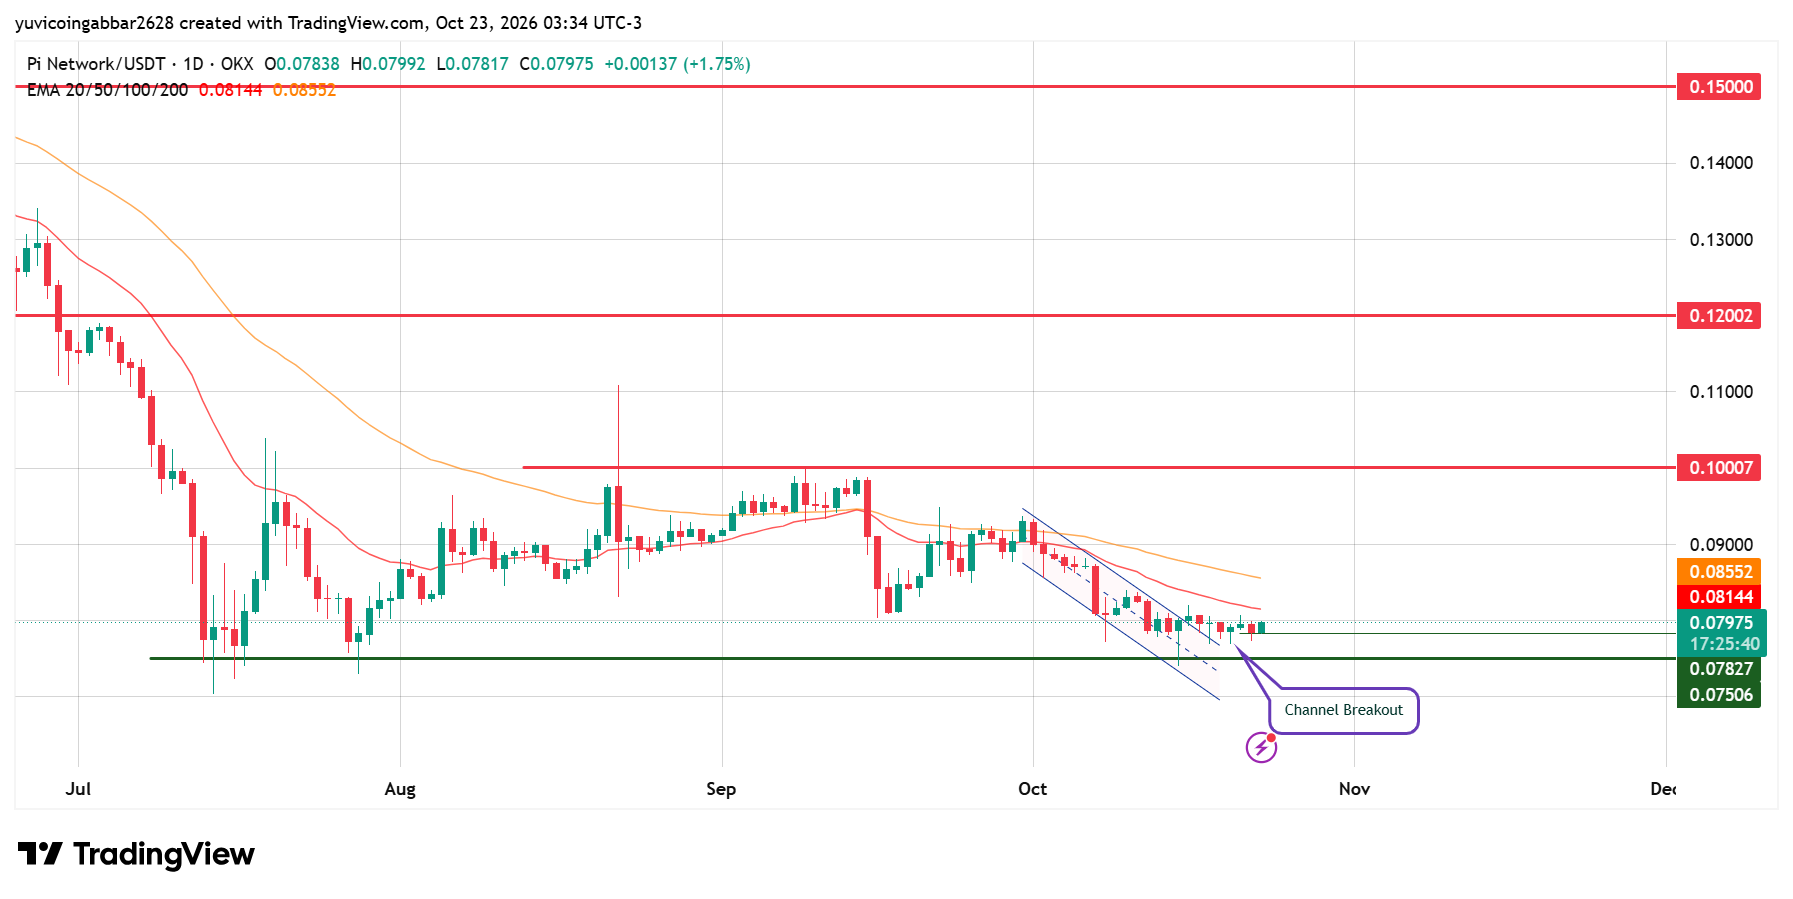
A channel is a pair of sloping trend lines that hold price inside a range. PI fell inside a falling channel through October and has now broken above its upper line.
The price confirmed the breakout but is still consolidating above the channel. Today's candle opened at $0.07838, touched the $0.07827 level, reached $0.07992 and closed the reading at $0.07975.
An EMA is a trend line that weights recent prices more heavily. The shorter 20 EMA $0.08144 sits below the longer 50 EMA $0.08552, which often points to weaker momentum. Both lines slope down and sit above the price as resistance.
Pi Network Forecast: Support and Resistance Levels
Since late July, $PI has mostly traded between $0.07506 and $0.10007.
Type | Level |
Highest marked level | $0.15000 |
Resistance 2 | $0.12002 |
Resistance 1 | $0.10007 |
Immediate support | $0.07827 |
Deeper support | $0.07506 |
Bull case: A daily close above the EMA 20 at $0.08144 and then the EMA 50 at $0.08552, with $0.07827 holding, would put $0.10007 in view.
Bear case: A drop toward $0.07506 opens if $PI closes a day below $0.07827, which would erase the channel breakout.
PI Scenarios and Invalidation (October 23, 2026)
Scenario | Trigger | Likely Outcome | Invalidation |
Bull | Close above $0.08552 | Move toward $0.10007 | Close below $0.07827 |
Base | Range of $0.07827 to $0.08144 | Sideways under the EMAs | Break of either level |
Bear | Close below $0.07827 | Slide toward $0.07506 | Close back above $0.07827 |
Pi Network Price Prediction: Can $Pi Network Reach $0.15000?
It would take a gain of about 88% from $0.07975. Any Pi Network Outlook near that level needs more than headlines, since PI must clear both EMAs, $0.10007 and $0.12002 in order. A bull run claim does not guarantee that path.
Pi Network Price Prediction 2026: Analyst View
Price sits under both EMAs, so a daily close above $0.08552 would be the first clear sign of strength.
Disclaimer
This article is for informational purposes only and isn't financial advice. Crypto markets are volatile. Always do your own research before making any trading decisions involving PI.

















