Axie Infinity Price Prediction August 2026: Can $AXS Surge 300%?


Axie Infinity has quietly worked its way back to a spot on the chart; that's actually happened before, and that's really the whole story behind this Axie Infinity price prediction august 2026.
$AXS is trading at $0.8317, up 0.6% today, sitting right at the same support zone that kicked off a massive rally the last time the price touched it.
Axie Infinity Price Today: Live Data and 24-Hour Change
$AXS is currently trading at $0.8317 right now, up 0.6% over the past day, moving inside a tight range between $0.8183 and $0.8371.
Market cap sits at $144.897M, with a fully diluted valuation of $224.565M, a fairly wide gap that's worth remembering. 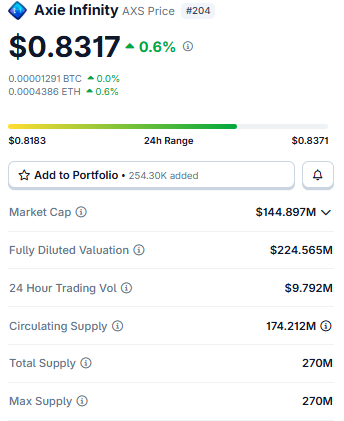
Source: $Axie Infinity Market Cap Data Taken From Coingecko, data as of July 31, 2026. Figures may vary slightly across other tracking websites.
24-hour trading volume came in at $9.792M, on the lower side for a coin of this size, which matters for how much weight to put on any single breakout or breakdown right now.
The circulating supply is 174.212M $AXS, and both the total and max supply are capped at 270M.
So there's still a decent chunk of $AXS left to enter circulation over time, even though the max supply itself isn't going anywhere.
$AXS Technical Analysis: Key Support and Resistance Levels
$AXS is trading near an important technical zone, where trend direction could soon be decided. The daily chart helps identify the levels that may act as support during pullbacks or resistance during rallies.
$Axie Infinity Daily Chart: Testing the Same Support Twice
This is where things get interesting.
$AXS is currently sitting at the exact support zone where it previously launched a 274.35% rally over about 32 days, backed by real volume north of 308M at the time. 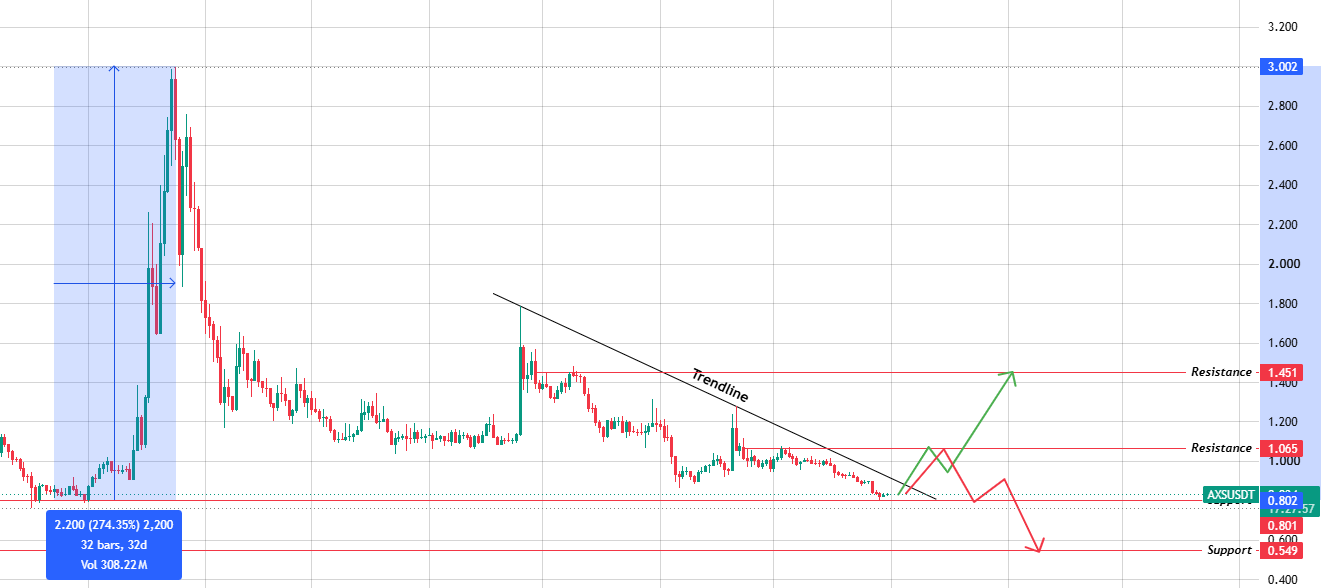
Source: Chart Taken From TradingView.
The price has come all the way back down to that same level, and this descending trendline has been capping every bounce since the last high.
If $AXS actually breaks above that trendline this time, the first resistance to watch is $1.065, with $1.451 next if buyers keep pushing.
But if the price gets rejected on this trendline retest instead, descending, meaning it pokes at the line and gets pushed back down, the more likely outcome is a break of the current support zone, opening the door to $0.549 below it.
$Axie Infinity Weekly Chart: Descending Channel
Zoom out to the weekly chart, and $AXS has been sliding lower inside a clean descending channel for a while now.
The most recent weekly candle opened at $0.897, ran up to a high of $0.898, dropped to a low of $0.801, and is running at $0.832.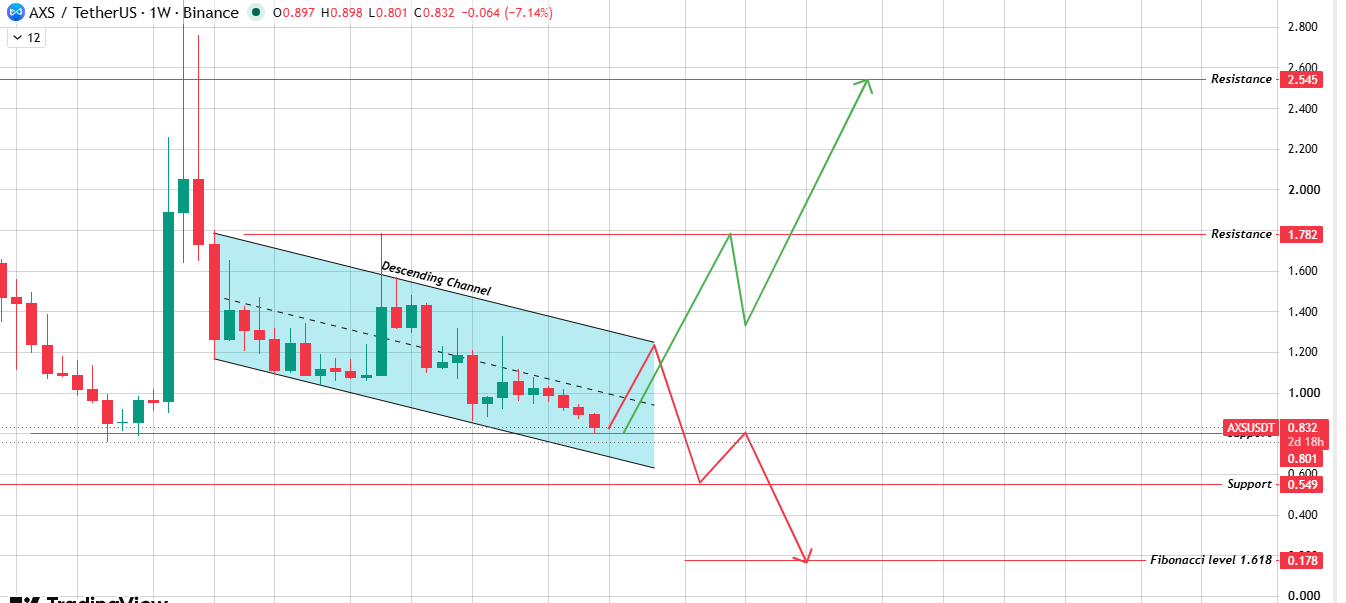
Source: Chart Taken From TradingView.
The price is sitting right near the lower boundary of this channel.
Break the structure, and the price is going to the upper boundary of the channel, and resistance stacks up at $1.782 first, then $2.545 if the breakout really carries through.
Break below the lower boundary instead, and support at $0.549 comes into play, with the 1.618 Fibonacci extension pointing down toward $0.178 in a deeper breakdown scenario.
Axie Infinity Price Prediction August 2026: Bull, Base, and Bear Cases
Here's what makes this Axie Infinity price prediction August 2026 genuinely interesting.
$AXS is sitting almost exactly where it sat right before it ran up 274% the last time this zone got tested.
That doesn't mean history repeats itself automatically, but it's the kind of level that tends to draw real attention from buyers and sellers alike.
| Scenario | Target | Invalidation Level |
|---|---|---|
| Bull | $1.065 – $1.451 (Daily) $1.782 – $2.545 (Weekly) | Rejection at the daily trendline: price fails to hold current support. |
| Base | $0.549 – $1.065 (Range-Bound) | Confirmed close outside either boundary. |
| Bear | $0.549 (Daily) $0.178 (Weekly) | Breakdown below current support and the weekly channel. |
For the bullish case to play out, $AXS needs to actually break its daily trendline with some real volume behind it and hold the weekly channel's lower boundary at the same time.
Manage that, and $1.065 comes into view first, then $1.451 on the daily chart, with the weekly targets of $1.782 and $2.545 opening up further out if the move has staying power.
The base case is a lot less dramatic. $AXS just keeps grinding sideways in this general zone without really breaking either way.
August 2026 Catalysts That Could Move Axie Infinity
Ronin ecosystem activity, new game releases or updates tied to Axie Infinity, and general play-to-earn sector sentiment are the main AXS-specific things worth tracking this month.
Beyond that, how AXS behaves at this daily trendline retest is probably the single biggest short-term catalyst, since it's the same level that triggered the last major rally.
What Analysts Are Forecasting (Axie Infinity)
Is Axie Infinity a good investment right now? That really depends on how this trendline retest plays out.
A confirmed break above it, especially with volume picking up from its currently modest levels, would be a genuinely strong signal given the history at this exact support zone.
A rejection, on the other hand, would suggest the market isn't ready to repeat that move just yet, and a support break could follow fairly quickly.
This is a chart-based analysis, not a guarantee. AXS's own history shows how sharply things can move once a level like this actually gives way.
Axie Infinity Long-Term Outlook: 2027 to 2030
If AXS clears its daily trendline and the weekly channel resistance over the coming months, a longer climb toward $1.782 and potentially $2.545 looks like a reasonable stretch target across 2027 and 2028.
What Axie Infinity is worth by 2030 will likely depend far more on real gaming and Ronin ecosystem adoption than on this one technical setup, but the current level is at least a meaningful starting point to watch.
Risks That Could Invalidate This Forecast (Axie Infinity)
The clearest risk is a rejection at the current daily trendline that leads to a break of support.
That would open the path toward $0.549, and if the weekly channel's lower boundary gives way too, the 1.618 Fibonacci level near $0.178 becomes the deeper downside target.
Given how thin current volume is at $9.792M, a low-volume breakdown wouldn't be surprising if broader market sentiment turns negative.
How to Buy and Store Axie Infinity Safely
AXS trades on most major exchanges, usually paired against USDT or USD.
Given the meaningful gap between circulating and total supply, it's worth watching future unlocks alongside the technical levels above.
Hardware wallets are the safer choice for larger holdings, while exchange wallets work fine for smaller, more actively traded amounts.
Disclaimer: This Axie Infinity price prediction is for informational and educational purposes only and should not be considered financial or investment advice. Cryptocurrency markets are highly volatile, and prices can change rapidly. Always conduct your own research and consult a qualified financial advisor before making any investment decisions.











.jpg)






