ANYONE Price Prediction 2026–2030: Bull Case or Pullback?


ANYONE Protocol (ANYONE) is trading around $0.2107, up 31.82% in the past 24 hours as of this data snapshot, taken at roughly 11:30 UTC on September 8, 2026.
That's a big single-day jump. And it's not happening on thin air.
Trading volume climbed 85.88% to $969.22K in 24 hours. Vol/market cap sits at 4.56%, which is healthy for a coin this size, a strong sign for ANYONE price today and a key data point for this ANYONE price prediction.
Why is it moving? A descending channel breakout on the daily chart, plus a fresh project update. More on both below.
Immediate resistance is the $0.2181 zone, the first Fibonacci extension level. Immediate support has shifted up to the $0.0861 zone, the prior channel floor. That's the setup driving this ANYONE price prediction.
Why Is ANYONE Price Moving Today?
This isn't random noise.
The daily chart shows a clean descending channel breakout, where price finally punched above months of lower highs and lower lows.
24H move: +31.82%. 7D context: price has climbed from an all-time low near $0.04913 (hit August 11, 2026) to today's level, a 342.81% recovery.
Market cap rose to $20.62M, up 32.29% in a day.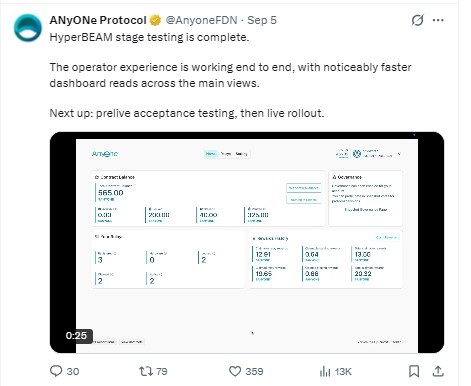
There's also a project-specific catalyst. ANyONe Protocol's team posted on September 5 that HyperBEAM testing update confirmed the operator dashboard is now working end to end, with faster reads. Prelive acceptance testing comes next, then live rollout.
Does the move look organic? Volume backing a breakout, plus a real product milestone, points that way. But one day of green candles never tells the full story.
Can ANYONE Hold Its Current Rally?
What the Current Trend Says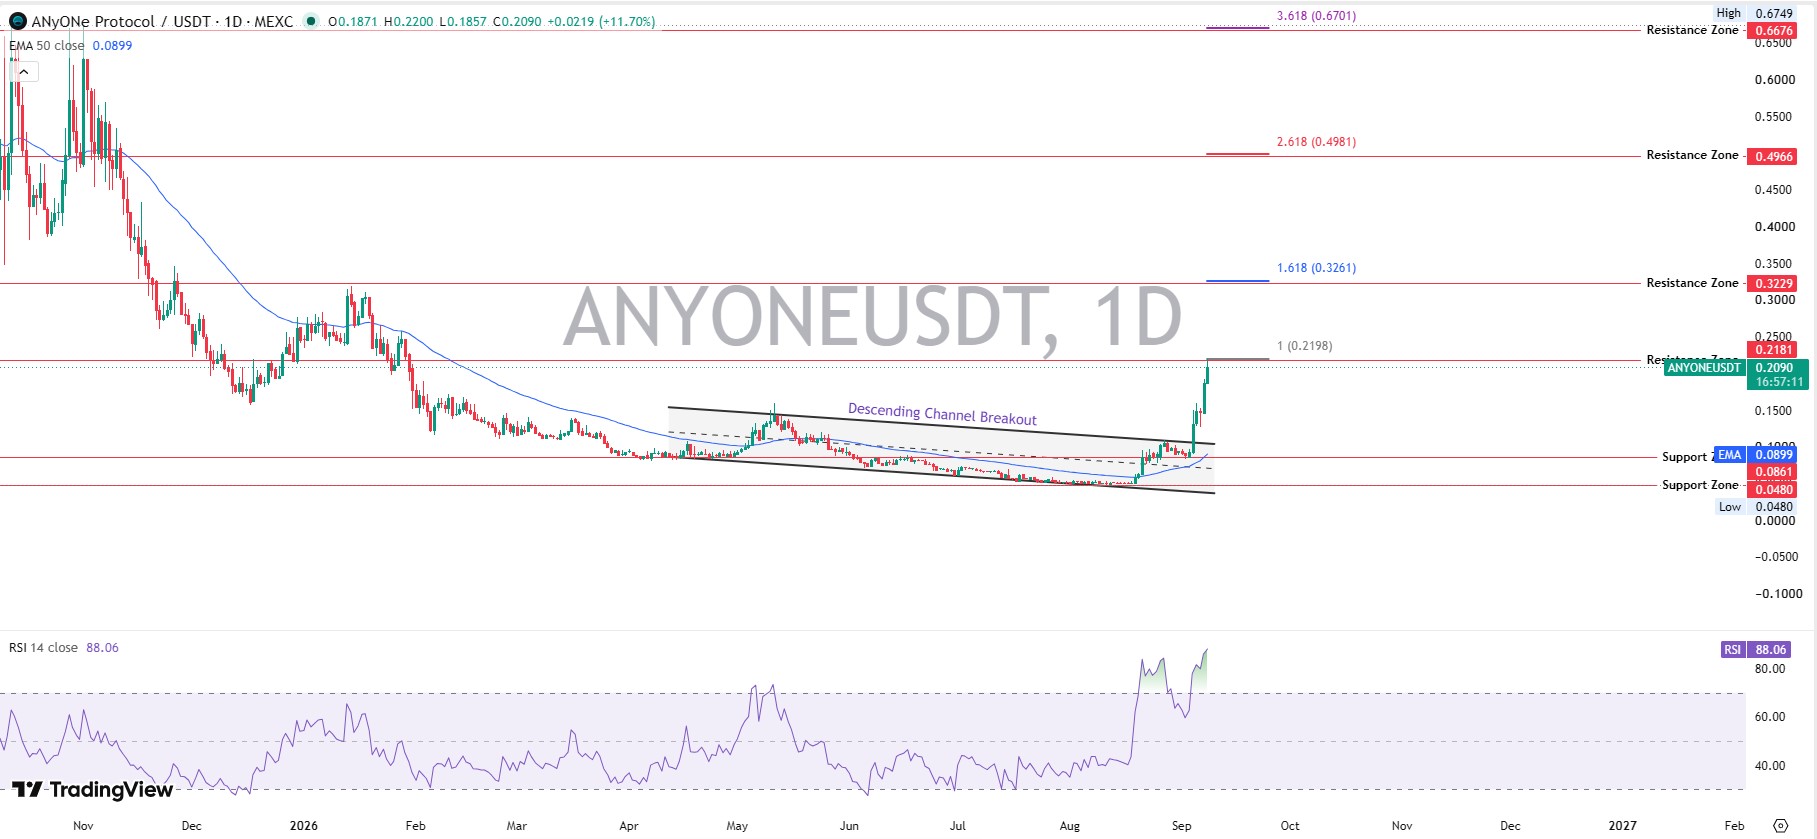
The 50-day EMA sits at $0.0899. The price is trading well above it, more than double.
That's an extended move. Extensions like this often cool off before they continue.
Is Volume Confirming the Move?
Yes, mostly. An 85.88% volume jump alongside a 31.82% price move is a decent ratio.
But volume alone doesn't guarantee follow-through. It just rules out a pure fakeout.
Is RSI Warning of a Pullback?
The 14-day RSI reads 88.06. That's deep overbought territory, above the standard 70 threshold by a wide margin.
When we pulled up the RSI chart, the reading stood out immediately. It's one of the highest levels this coin has hit in months.
What Would Confirm a Breakout?
A daily trade holding above $0.2181 on sustained volume would confirm it. A retest of the breakout zone near $0.15-$0.17 that holds as support would also help the bull case.
ANYONE Price Prediction for 2026
Scenario | Price Range | Key Condition |
Bear Case | $0.08–$0.12 | Support breakdown below the channel floor |
Base Case | $0.15–$0.22 | Consolidation under resistance |
Bull Case | $0.33–$0.50 | Clean breakout with volume follow-through |
The bear range reflects a return to the old channel support zone if this rally fades. The base case assumes sideways chop under the $0.2181-$0.3229 resistance band. The bull case only opens up if the price clears the 1.618 and 2.618 Fibonacci zones with real volume behind it.
For context on how other small-cap altcoins are setting up right now, check other price predictions covering similar breakout patterns.
ANYONE Price Prediction 2027–2030
ANYONE Price Prediction 2027
A conservative range: $0.20–$0.45, assuming the project ships HyperBEAM's live rollout and adoption grows steadily.
ANYONE Price Prediction 2028
$0.25–$0.70, contingent on broader altcoin strength and continued ecosystem growth.
ANYONE Price Prediction 2029
$0.30–$1.00, if network usage and holder growth keep trending up.
ANYONE Price Prediction 2030
$0.35–$1.30, a scenario where ANYONE reclaims a meaningful share of its 2024 all-time high of $2.29, without fully retesting it.
None of these longer-term ranges are set in stone. Keep an eye on the crypto events calendar for upcoming milestones that could shift these targets.
ANYONE Support and Resistance Levels to Watch
Immediate Support
$0.0861, the descending channel's prior floor.
Major Support
$0.0480, the deeper structural low from earlier this year.
Immediate Resistance
$0.2181, the first Fibonacci resistance zone.
Breakout Target
$0.3229, the 1.618 extension level.
Bearish Invalidation Level
A daily trade back below $0.0861 would invalidate the current bullish structure.
ANYONE Technical Analysis: RSI, MACD and Trend
RSI Analysis
At 88.06, RSI is flashing overbought. Historically, readings this high precede at least a short cool-off.
MACD Analysis
The MACD line sits at 0.0283, above the signal line at 0.0173. The histogram is positive at 0.0109. That's bullish momentum, plain.
Moving Average Trend
Price trading far above the 50-day EMA ($0.0899) confirms strong short-term momentum. But it also means the trend is stretched.
Volume and Momentum
Volume is expanding alongside price. That's the healthiest sign in this whole chart.
Market Structure
Turns out, the breakout above the descending channel is the single most important structural shift here. It flips the multi-month downtrend into a higher-timeframe uptrend, at least for now.
Pull up the live ANYONE chart yourself and watch how the price reacts around the $0.2181 zone over the next few sessions.
Bull Case vs Base Case vs Bear Case for ANYONE
Scenario | What Must Happen | Target | Risk |
Bull | Break $0.2181 with volume | $0.3229+ | Sharp rejection, RSI cool-off |
Base | Holds $0.0861 support | $0.15–$0.22 | Sideways chop for weeks |
Bear | Loses $0.0861 | $0.05–$0.08 | Deeper retracement toward the August low |
Sentiment across the wider altcoin space matters here too. Broader memecoin market news often sets the risk tone that smaller caps like ANYONE end up following.
What Could Push ANYONE Higher?
A successful HyperBEAM live rollout would be a real catalyst, not just a headline. General strength across the AI crypto sector news cycle tends to lift tokens like this one alongside it.
Bitcoin strength and easing liquidity conditions across the broader market would help ANYONE ride the wave higher too.
Wider token distribution matters as well. Watch for any new exchange listings that could bring fresh volume and reduce the whale concentration problem.
What Could Send ANYONE Price Lower?
RSI at 88 is the biggest red flag right now. Overbought conditions, this extreme, usually invite profit-taking.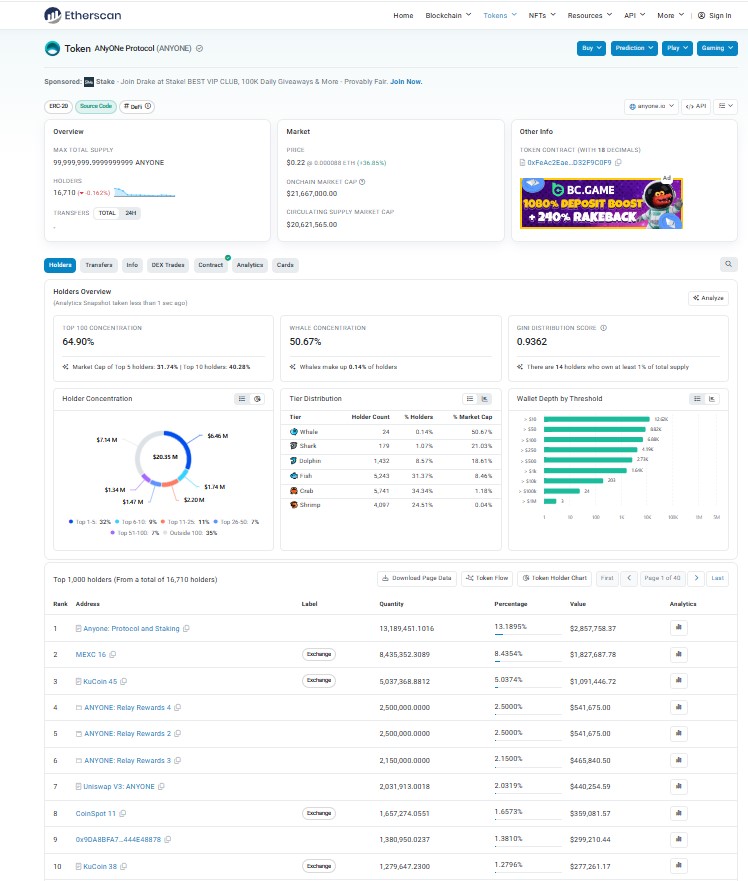
And there's the concentration problem. On-chain data shows the on-chain holder data putting top 100 wallets at 64.90% of supply, with whale concentration at 50.67% and a Gini score of 0.9362. That's heavy concentration risk.
A rejection at $0.2181, a volume decline, or a wider market risk-off move could all send the price back toward $0.15 or lower.
Can ANYONE Reach $1?
Fine, let's do the math. From $0.2107, hitting $1 requires roughly a 375% gain.
At a current circulating supply of 97.84M ANYONE, that implies a market cap near $97.8M, about four-and-a-half times today's $20.62M.
That's not impossible for a small-cap token during a strong altcoin cycle. But it needs sustained volume, real adoption, and a market environment that isn't fighting it.
Traders hunting for similar early-stage upside sometimes browse the crypto airdrop tracker for other tokens at this stage of their cycle.
ANYONE Price Prediction: Trader Takeaway
Bullish above $0.0861. Next resistance at $0.2181. Breakout target $0.3229. Key support $0.0861. Bearish below $0.0480. Invalidation on a daily trade under $0.0861.
Cross-check the latest numbers on ANYONE market data before making any move.
Disclaimer: This article is for informational purposes only and isn't financial advice. Crypto markets are volatile, and prices can move sharply in either direction. Always do your own research and consult a qualified financial advisor before making investment decisions.
Also read:

















