Arbitrum Price Prediction: Why $ARB Surges 35%+ Today, What’s Next?


$ARB just jumped higher, breaking through levels that had capped it for weeks, and shorts are struggling to cover.
This Arbitrum price prediction lands right as buyers pile back in, volume exploding and timelines lighting up with calls for more upside.
Everyone who relaxed on ARB during the grind lower is watching this move with FOMO kicking in hard.
Blow-off top, or just getting started?
Market data was checked on September 1, 2026, at 09:47 IST.
Arbitrum Price Prediction Today: Market Overview
Metric | Value |
Price | $0.111242 |
24h Change | +35% |
Market Cap | $738.25M |
FDV | $1.1B |
24h Volume | $430M+ |
Vol/Mkt Cap (24h) | 56.26% |
Total Supply | 10B ARB |
Circulating Supply | 6.67B+ ARB |
Source: Data from CoinMarketCap as of September 1, 2026, at 09:47 IST. Figures may vary slightly across other tracking websites.
Liquidation and Volume Data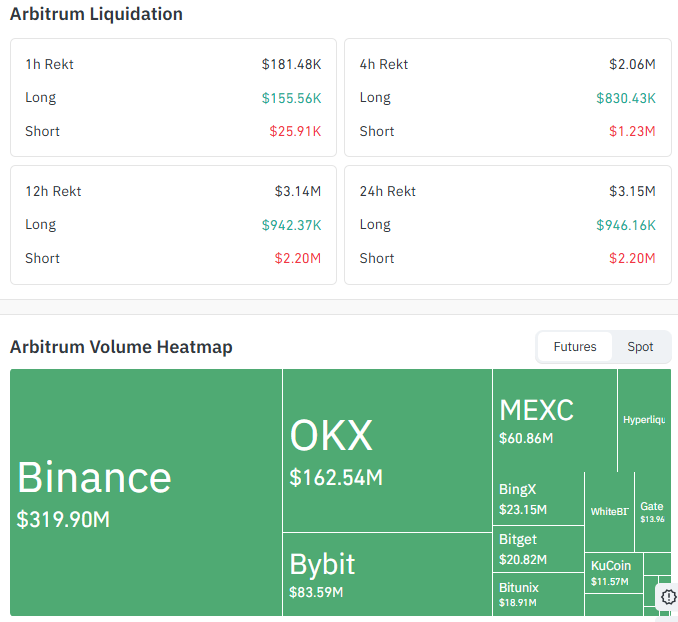
Window | Total Rekt | Long | Short |
1h | $181.48K | $155.56K | $25.91K |
4h | $2.06M | $830.43K | $1.23M |
12h | $3.14M | $942.37K | $2.20M |
24h | $3.15M | $946.16K | $2.20M |
This is Coinglass futures liquidation data, kept separate from CoinMarketCap spot volume above.
Futures volume by exchange over 24h: Binance $319.90M, OKX $162.54M, Bybit $83.59M, MEXC $60.86M, BingX $23.15M, Bitget $20.82M, Bitunix $18.91M and KuCoin $11.57M, with smaller volume spread across Gate, WhiteBIT, and Hyperliquid.
$ARB Price Prediction Chart: Technical Analysis
Pair: ARB/USDT · Market: Spot (Crypto index) · Timeframe: 1D · Source: TradingView · Timestamp: September 1, 2026, 09:47 UTC+5:30
$ARB is trading at $0.111242, after a sharp move off the recent lows that carried the price well clear of both EMAs.
Price confirms the breakout after breaking below the $0.101299 support level, and if it holds, we can assume the price will continue its rally.
The EMA cluster now sits far below the spot, with the 20 EMA at $0.091564 and the 50 EMA at $0.087613, both acting as distant support rather than resistance.
RSI (14) reads 70.71 against its 63.67 average, putting ARB in overbought territory for the first time in weeks.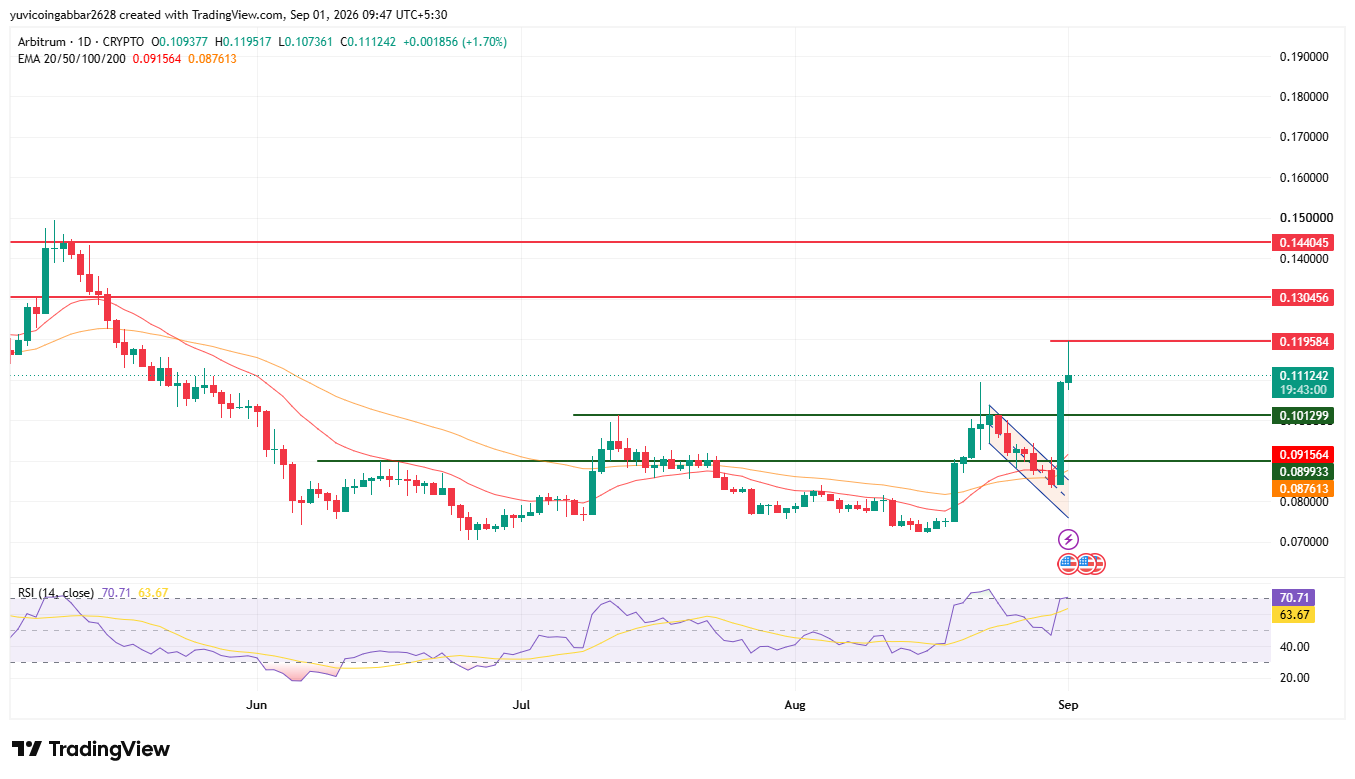
Arbitrum Price Prediction: Key Levels
Level Type | Price |
Resistance 3 | $0.144045 |
Resistance 2 | $0.130456 |
Resistance 1 (nearest) | $0.119584 |
Immediate Price Reference | $0.111242 |
First Confirmed Support | $0.101299 |
Deeper Support | $0.089933 |
$ARB Forecast: Bull Case vs Bear Case
Bull case: Holding above $0.111242 and clearing the nearest resistance at $0.119584 would confirm buyers are in control rather than just squeezing shorts. A confirmed break there opens the path toward $0.130456 and eventually $0.144045.
Bear case: RSI at 70.71 leaves ARB stretched short-term, and a rejection at $0.119584 followed by a slide back below $0.101299 would suggest this was a squeeze rather than a trend change, exposing $0.089933 next.
ARB Price Scenarios: Triggers and Invalidation
Scenario | Trigger | Likely Outcome | Invalidation Point |
Breakout continuation (bullish) | Daily close above $0.119584 | Move toward $0.130456, then $0.144045 | Close back below $0.111242 |
Consolidation (hold) | Price holds between $0.101299 and $0.119584 | Range-bound chop before the next leg | Break of either boundary |
Breakdown (bearish) | Daily close below $0.101299 | Drop toward $0.089933 | Reclaim above $0.101299 |
Can ARB Reach $0.144045?
$0.144045 is the highest resistance marked on the chart.
Getting there would need $ARB to first clear $0.119584, then hold above $0.130456, a multi-stage move rather than a single leg, especially with RSI already overbought.
Arbitrum Price Prediction: Expert View
According to CoinGabbar analysts, this looks like a short squeeze more than a confirmed trend shift, with liquidation data doing most of the talking.
$0.111242 to $0.119584 is the zone that decides whether this holds or fades.
Disclaimer
This piece is for informational purposes only and isn't financial advice. The levels and scenarios above are based on technical chart analysis and publicly available data at the time of writing, and crypto markets can move sharply within hours. Do your own research and consider your own risk tolerance before acting on anything discussed here.
Also read:
















