Cardano Price Prediction: Blockforce News Meets ADA Breakout Fight


Cardano price prediction traders are watching a chart that has punished every bounce so far.
ADA keeps tapping the same descending trendline, and each attempt to hold it has produced a lower low than the one before.
The first retest faded away slowly, but the second retest wiped out in a single candle, and now price is sitting right back at that same trendline for a third look.
A fresh piece of on-chain news around Cardano's infrastructure is adding some context to the setup as well.
Here is the full picture for this ADA technical analysis.
Cardano Price Today: Live Data and 24-Hour Change
ADA is trading at $0.201 at the time of writing, up $0.008102, or 4.2 percent, over the past 24 hours.
Futures volume over the same period stands at $371.26 million, while spot volume sits at $67.23 million.
Market cap is holding at $7.37 billion, open interest is at $441.57 million, and circulating supply is 36.71 billion ADA against a total supply of 44.99 billion and a max supply of 45.00 billion tokens.
Source: CoinGlass market data, September 1, 2026.
Cardano Latest News and Market Catalyst
Cardano has gone live as the public settlement layer for the Blockforce traceability network, with more than 500,000 supply chain documents already anchored on the network. The architecture pairs Cardano with a dual ledger setup designed to give supply chain records a verifiable, tamper-resistant trail.
News like this feeds directly into the Cardano coin price prediction narrative because it points to real usage building on the network, separate from whatever the chart is doing in the short term.
It does not change the trendline structure ADA is fighting right now, but it does give bulls a fundamental angle to lean on if the breakout attempt gains traction.
Source: BSCNews on X, August 31, 2026.
ADA Liquidation Data and Market Positioning
Liquidation flow over the past day leans firmly toward shorts, showing that traders betting on further downside have absorbed most of the pain.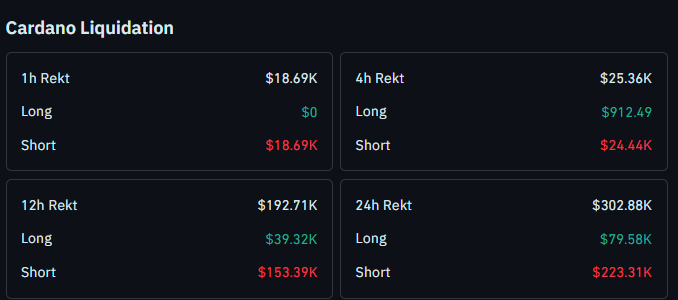 Over the last 24 hours, $302.88K in positions were liquidated, with $223.31K of that coming from shorts against just $79.58K from longs.
The 12-hour window tells a similar story, with $192.71K total rekt, $153.39K from shorts versus $39.32K from longs.
Zoom into the last 4 hours and the short-side pressure is even more lopsided, with $25.36K liquidated overall and shorts taking $24.44K of that against only $912.49 from longs.
The 1-hour window shows every liquidated dollar coming from shorts, at $18.69K against $0 from longs, a sign that the latest push higher off the trendline caught short sellers wrong-footed.
This ADA liquidation data lines up with a market that has been squeezing shorts on this bounce rather than flushing out fresh long positions.
Source: CoinGlass liquidation data, September 1, 2026.
Quick Take
CMP: $0.2005 on the 4-hour Binance perpetual chart
Bullish trigger: 4-hour close above $0.2067 needed to confirm a trendline breakout
Bullish continuation levels: $0.2587, then $0.2885, major resistance at $0.3279
Bearish trigger: 4-hour close below $0.1858
Bearish target on breakdown: $0.1709
Data timestamp: September 1, 2026, 09:37 UTC+5:30
Risk note: ADA has produced a lower low on both retests of this descending trendline so far, so a close above $0.2067 is needed before this Cardano price prediction should be treated as a genuine breakout rather than another failed bounce
Cardano Technical Analysis September 2026
On the 4-hour ADA/USDT perpetual chart on Binance, the price has been sliding down along a descending trendline, and every retest of that line has created a lower low than the previous one.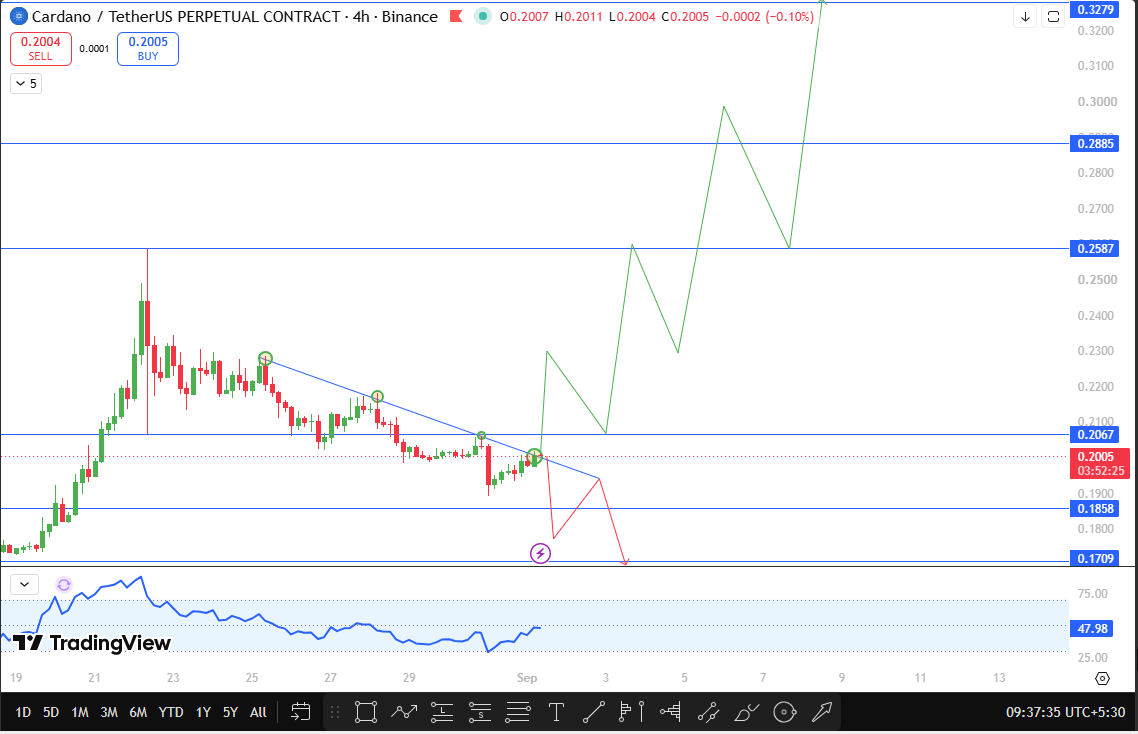 The first retest saw a slow, grinding fall away from the trendline, while the second retest broke down in a single sharp candle instead of drifting lower.
ADA has now come back up to test that same trendline for a third time and is holding close to it again, which is the setup at the center of this cardano technical outlook.
If $ADA breaks and closes above $0.2067 on the 4-hour chart, that would count as a trendline breakout, opening the door toward $0.2587, then $0.2885, with $0.3279 standing as the major resistance target for this Cardano price forecast.
On the downside, if ADA breaks and closes below $0.1858, the next support to watch drops to $0.1709.
The momentum reading of the RSI on the chart currently sits at 47.98, a neutral level that reflects a market still deciding whether this third trendline test holds or fails like the first two.
Source: TradingView, ADA/TetherUS Perpetual, 4-hour chart, Binance, September 1, 2026, 09:37 UTC+5:30.
ADA Support and Resistance Levels
Level Type | Price | Change from CMP | Note |
Major Resistance | $0.3279 | +63.5% | Extended upside target |
Resistance 2 | $0.2885 | +43.9% | Mid-breakout target |
Resistance 1 | $0.2587 | +29.0% | First target after breakout |
Trendline Breakout Level | $0.2067 | +3.1% | Level that confirms trendline breakout |
Current Price | $0.2005 | — | CMP on 4-hour chart |
Support 1 | $0.1858 | -7.3% | Trendline breakdown trigger |
Support 2 | $0.1709 | -14.8% | Deeper support level |
Bull, Base, and Bear Case for ADA
In the bull case, $ADA finally holds this third trendline retest and closes above $0.2067 with real follow-through, opening a path toward $0.2587 and then $0.2885, with $0.3279 as the stretch target for this ADA price prediction.
The base case has $ADA chopping between $0.1858 and $0.2067 for a while as the market digests the Blockforce traceability news against a chart structure that has failed twice already.
In the bear case, $ADA closes below $0.1858, extending the pattern of lower lows on each trendline test, and price works its way toward a retest of $0.1709.
Risks to This Cardano Price Prediction
The biggest risk here is a repeat of what has happened on both prior retests, where $ADA touched the trendline and still produced a lower low instead of breaking out.
A third failure at this level would weaken the bullish case considerably and could accelerate a move toward the lower support zone.
The current short liquidation lean also cuts both ways, since a squeeze can fade just as fast as it built if buyers do not step in with volume.
Broader Bitcoin price action, shifts in overall crypto risk sentiment, and general altcoin weakness could all pull $ADA away from this setup regardless of how the trendline test plays out.
This ADA crypto prediction is based purely on current chart structure and available data, and conditions can change quickly.
Glossary
CMP: Current Market Price, the price at which an asset is trading right now.
Descending Trendline: A falling resistance line connecting a series of lower highs, often used to gauge whether a downtrend is still intact.
Open Interest: The total number of outstanding derivative contracts that have not been settled.
Liquidation: The forced closing of a leveraged position when losses exceed the trader's available margin.
Disclaimer
This article is for informational purposes only and should not be considered financial advice. Cryptocurrency markets are highly volatile, and readers should conduct their own research before making any investment decisions.
Also read:
















