$954.8M Biggest Report! $AVAX Chart Secret: Avalanche Price Prediction


A fresh number just hit crypto Twitter, and it's got AVAX holders paying attention: Avalanche's ecosystem has reportedly generated $954.8M in on-chain production.
This Avalanche price prediction looks at whether that headline can push AVAX out of its multi-week range, with the bullish case needing a close above $6.7741 in the next few days, while a break below $6.3732 would put that idea on hold fast.
Market data was checked on August 14, 2026, at 11:06 IST.
Avalanche Price Prediction Today: Market Overview
Metric | Value |
Price | $6.4169 |
24h Change | -1.5% |
Market Cap | $2.77B |
FDV | $4.59B |
24h Volume | $218.3M+ |
Vol/Mkt Cap (24h) | 7.89% |
Total Supply | 463.44M AVAX |
Max Supply | 715.74M AVAX |
Circulating Supply | 431.77M AVAX |
Holders | 181.5K |
Source: Data from CoinMarketCap as of August 14, 2026, at 11:06 IST. Figures may vary slightly across other tracking websites.
$954.8M Onchain Production: What the Report Says
A post from the account MSB Intel claims Avalanche's latest economic research estimates the ecosystem has generated $954.8M in on-chain production. 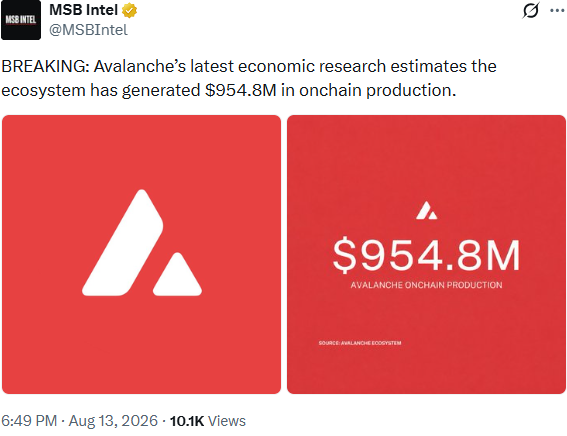
Source: Data From MSB Intel
The post doesn't link to the underlying research report or explain the exact methodology or time period behind that figure.
Note: CoinGabbar could not independently verify the $954.8M number, the research methodology, or the timeframe it covers, since the source here is a social media post rather than the original Avalanche research report.
This figure should be treated as reported, not confirmed.
AVAX Price Prediction Chart: Technical Analysis
Pair: AVAX/USD · Market: Spot (Crypto) · Timeframe: 4H · Source: TradingView · Timestamp: August 14, 2026, 11:06 UTC+5:30
AVAX is trading at $6.4169, still stuck inside the same consolidation box it has held for weeks now.
The price is boxed between marked resistance levels above and support levels below, with the current candle sitting almost exactly at the midpoint of that range.
RSI (Relative Strength Index, a momentum reading that shows if an asset is overbought or oversold) sits at 49.54, dead neutral, which fits a market that isn't leaning either way yet.
EMA (Exponential Moving Average, a trend indicator that gives more weight to recent price action) 20 sits at $6.4165, and EMA 50 sits at $6.4464, both essentially sitting right on top of the current price, showing this is a genuinely undecided market rather than a clear trend.
A breakout from this consolidation could trigger a big move in either direction, so stay alert. Check the chart for the key levels to watch.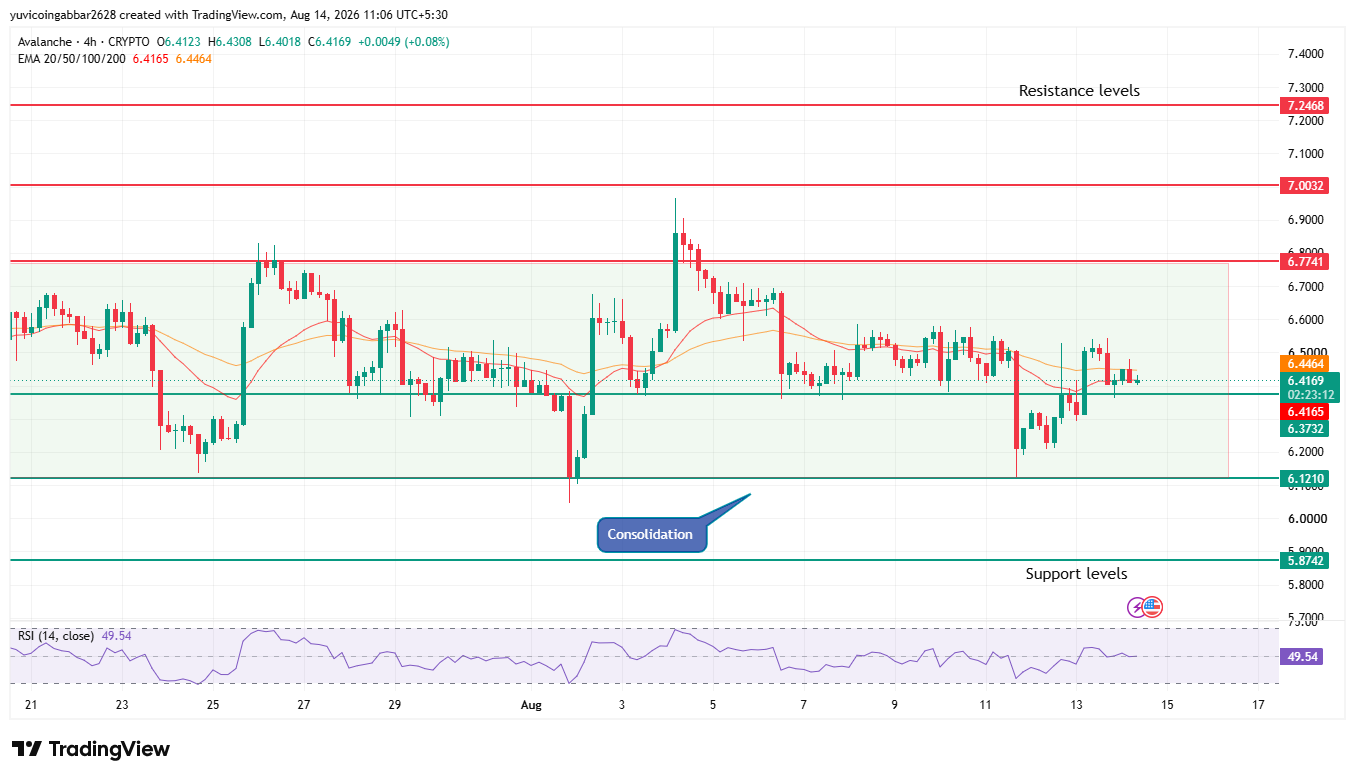
Support and Resistance Levels
Level Type | Price |
Resistance 3 | $7.2468 |
Resistance 2 | $7.0032 |
Resistance 1 (nearest) | $6.7741 |
Immediate Price Reference | $6.4169 |
First Support | $6.3732 |
Deeper Support | $6.1210 |
Structural Floor | $5.8742 |
EMA Levels
EMA | Price |
EMA 20 | $6.4165 |
EMA 50 | $6.4464 |
Avalanche Price Prediction: Bull Case vs. Bear Case
AVAX price target 2026 Bull case: Holding above $6.3732 and clearing both EMAs near $6.4165 to $6.4464 would be the first sign this range is ready to break higher.
A confirmed close above $6.7741 would open the path toward $7.0032, and the $954.8M on-chain production headline could add extra sentiment if it keeps circulating.
AVAX price target 2026 Bear case: A close below $6.3732 would put the consolidation floor in question and suggest sellers are ready to take control.
Losing $6.1210 would expose $5.8742 as the next downside level, regardless of what the on-chain production report says
AVAX price target: Price Scenarios: Triggers and Invalidation
Scenario | Trigger | Likely Outcome | Invalidation Point |
Trendline reclaim | Close above $6.7741 and above both EMAs | Move toward $7.0032, then $7.2468 | Rejection back below $6.7741 |
Channel hold | Price stays between $6.3732 and $6.7741 | Choppy, range-bound trading | Break of either boundary |
Channel breakdown | Close below $6.3732 | Move toward $6.1210, then $5.8742. | Reclaim of $6.3732 |
Can AVAX Reach $7.2468?
$7.2468 is the highest resistance level marked on the chart.
Reaching it would require AVAX to first clear $6.7741, then $7.0032, before making a final push toward $7.2468, a multi-stage move rather than a single leg, especially with EMA 20 and EMA 50 sitting right on top of the current price.
What Could Invalidate the Bullish Setup?
A rejection at $6.7741 followed by a close back below $6.3732 would put the breakout case on hold.
A deeper break below $6.1210 and eventually $5.8742 would undermine the bullish setup entirely, no matter how much attention the on-chain production number gets.
Avalanche Price Prediction: Expert View
According to CoinGabbar analysts, AVAX remains genuinely undecided right now, with RSI at 49.54 and both EMAs sitting almost exactly on the current price.
The $954.8M on-chain production headline is generating attention, but it hasn't shown up as a directional move on the chart yet.
The $6.3732 to $6.7741 range is the real battleground: a confirmed close outside either side of that box is what would actually confirm the next move, not the headline alone.
Avalanche Price Prediction: Data Sources
Price, EMA, and RSI data referenced from a 4H AVAX/USD chart via TradingView, timestamped August 14, 2026, 11:06 UTC+5:30. Market cap, FDV, volume, and supply data referenced from CoinMarketCap. The $954.8M onchain production figure is referenced from a post by the account MSB Intel and has not been independently verified by CoinGabbar.
Disclaimer: This piece is for informational purposes only and isn't financial advice. The levels and scenarios above are based on technical chart analysis and publicly available data at the time of writing, and crypto markets can move sharply within hours, so past patterns don't guarantee future outcomes. It's worth doing independent research and considering your own risk tolerance before acting on any of the levels discussed here.
Also read:

















