Basecat Price Prediction: Can BASECAT Rally After Crypto.com Listing?


Basecat Price Prediction: $BASECAT Eyes Next Move After 66% Rally
Something is pulling traders back toward a small Base-chain cat coin this week, and the volume charts are the first clue. Here's the setup worth understanding: a listing wave, a liquidation squeeze, and a chart testing patience all at once. So where does this leave anyone watching from the sidelines?
Is Basecat About to Make Its Next Big Move?
Basecat price prediction conversations picked up fast this week, and there's a real reason for that. This coin didn't drift higher quietly. It ripped.
We noticed the move before the headlines caught up. When we pulled up the exchange listings, the timing lined up almost perfectly with the price action.
Traders love a fresh catalyst. And this one arrived in twos.
$BASECAT isn't some obscure ticker anymore. It's a Base-chain memecoin with a cat mascot and exchange backing that smaller tokens rarely get this early.
Is the setup as clean as it looks? That's worth sitting with.
Why Is Basecat Price Moving Today?
Two announcements did the heavy lifting here. Crypto.com added $BASECAT for direct trading through its app on August 28, opening the token to fiat buyers using USD, EUR, and other currencies.
Days earlier, Aster DEX added a new BASECAT perpetual listing with up to 3x leverage. Leverage products tend to amplify both the rally and the eventual pullback.
Turns out, both events landed inside the same trading week. That's rarely a coincidence.
New buyers arrived, selling pressure stayed thin, and price found air above prior resistance.
$BASECAT price today sits well above where it traded before the listings hit.
$BASECAT Price Data Snapshot (as of 09:00 UTC, August 31, 2026)
This section stands alone deliberately, so the raw numbers stay easy to reference without digging through prose.
Current price: $0.0359, up roughly 66% over 24 hours
Market capitalization: approximately $35.89M
24-hour trading volume: around $22M, a 61.66% volume-to-market-cap ratio
Fully diluted valuation: roughly $35.89M
Circulating supply: 999.99M BASECAT of a 1B max supply
Holders: roughly 22,700 to 23,000 wallets
24-hour range: $0.02087 low to $0.04028 high
All-time high: $0.04069, set August 24, 2026, now about 14.43% below that mark
All-time low: $0.00007346, set August 15, 2026
Data referenced from CoinMarketCap market data.
$BASECAT Chart Analysis: What the 4-Hour Candles Show
The 4-hour chart on MEXC tells a choppy but constructive story. $BASECAT trades near $0.036, up about 7.18% on the session, in a range between $0.0329 and $0.0388.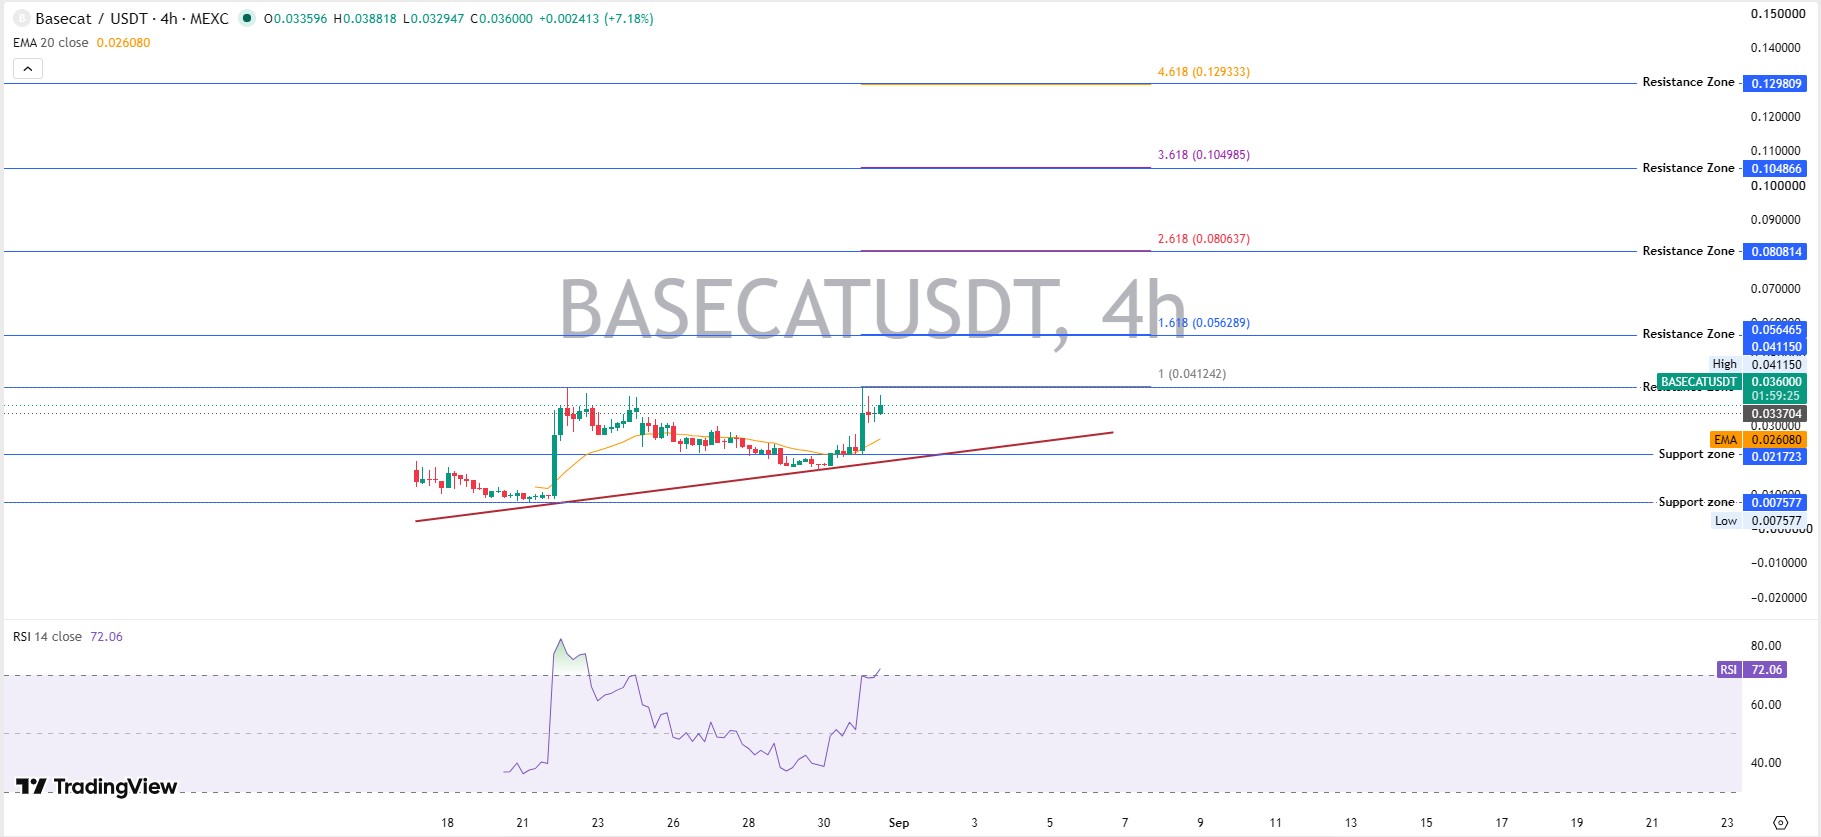
An ascending trendline has held since mid-August. Each dip found buyers a little higher than the last.
The 20-period EMA sits near $0.02608, well below trades. That gap points to stretched short-term momentum.
RSI reads 72.06 on the 14-period. Overbought is not a crash signal but a caution flag.
Fibonacci extensions mark resistance zones near $0.0415, $0.0565, $0.0808, $0.1049, and $0.1298. Support clusters near $0.0217 and $0.0076.
$BASECAT needs trading above the EMA and the trendline to keep this $BASECAT price prediction leaning bullish.
Support, Resistance, and What Would Break the Setup
Immediate resistance sits at $0.0412, the recent high on this leg. A close above that opens room toward the $0.0565 zone.
Support holds near $0.0217, the mid-August base. Below that, the trendline itself becomes the tell.
$BASECAT daily price prediction models built purely on trading structure favor continuation while the trendline holds and RSI cools without collapsing.
But RSI above 70 rarely stays there long. And a sharp rejection near $0.041 wouldn't shock anyone watching closely.
Is Basecat a Memecoin Worth the Risk?
$BASECAT is a memecoin, and memecoin math works differently than utility-token math.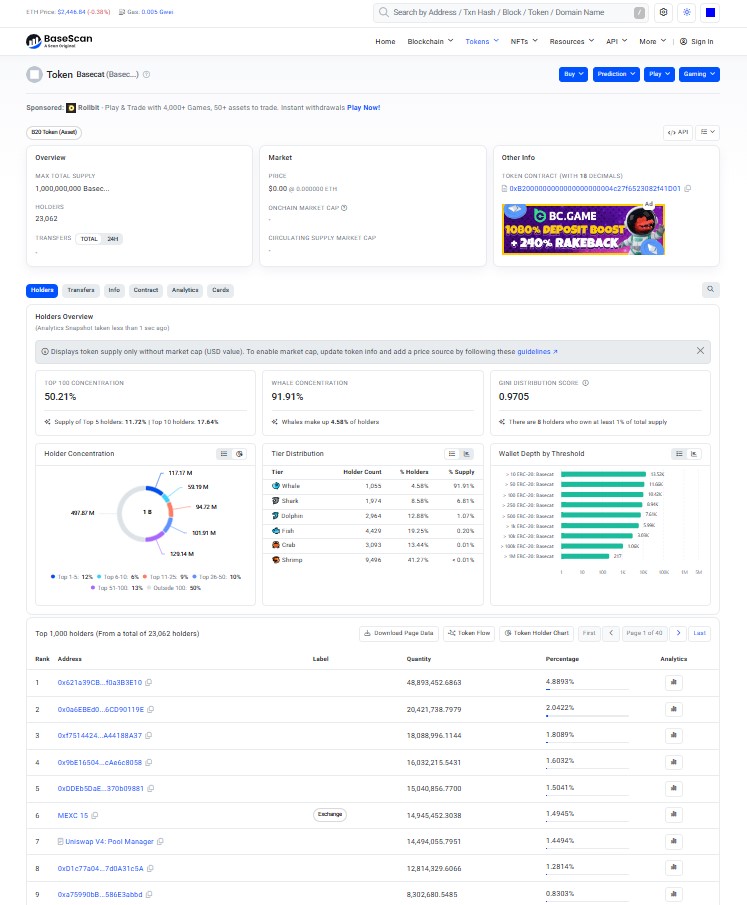
Basescan holder data shows the top 100 wallets control about 50.21% of supply. Whale-tier wallets, just 4.58% of holders, hold 91.91% of the token. A Gini coefficient near 0.97 confirms heavy concentration.
That's a thin float doing most of the price work. Fine, but worth knowing before sizing a position.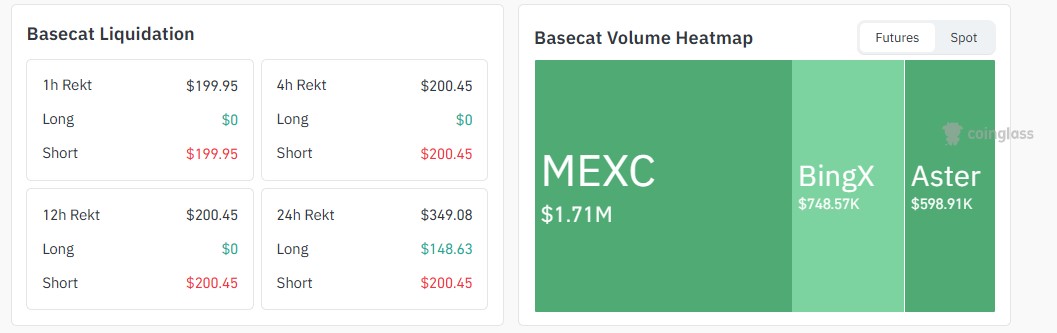
Liquidation numbers from CoinGlass data show shorts took the pain recently, $349.08 in 24-hour liquidations, almost entirely shorts. That's a squeeze fingerprint, not pure accumulation.
Volume splits mostly across MEXC ($1.71M), BingX ($748.57K), and Aster ($598.91K). Basecat's CertiK rating sits at 3.5, middling.
Basecat Price Prediction: Bear, Base, and Bull Scenarios
Timeframe | Bear Case | Base Case | Bull Case | Probability | Invalidation |
7 Days | $0.0217 | $0.0330 to $0.0412 | $0.0565 | Bear 25% / Base 50% / Bull 25% | Trendline break below $0.021 |
30 Days | $0.0150 | $0.0400 to $0.0565 | $0.0808 | Bear 30% / Base 45% / Bull 25% | Loss of $0.015 support |
Early 2027 | $0.0076 | $0.0565 to $0.1049 | $0.1298 | Bear 30% / Base 40% / Bull 30% | Volume collapse below $2M daily |
This $BASECAT price prediction table reflects trading structure and listing momentum, not guaranteed outcomes. Crypto markets move fast, and thin-float tokens move faster.
Key Risks That Could Derail the Basecat Price Prediction
Overbought RSI readings tend to cool off, sometimes sharply. Watch for a failed retest near $0.041.
Whale concentration remains the bigger long-term risk. A handful of wallets could pressure prices if they decide to exit.
Leverage from the new Aster perpetual listing cuts both ways, fueling rallies and accelerating drops.
Disclaimer
This article is for informational purposes only and does not constitute financial, investment, or trading advice. Cryptocurrency markets, especially memecoins like $BASECAT, carry high volatility and risk. Always do independent research and consult a licensed financial advisor before making investment decisions.
Also read:
















