Aave Price Prediction: Wolfe Wave Hints at Explosive Move


Aave is one of the largest decentralized lending and borrowing protocols in crypto, letting users lend and borrow digital assets directly without a middleman.
Today, AAVE is trading around $123.05, down about 0.5 percent over the last 24 hours, as the price consolidates inside a well-defined chart pattern that traders are watching closely for the next big move.
This Aave Price Prediction breaks down where AAVE could be headed next.
Live Market Data
Metric | Value |
Price | $123.05 (-0.5%) |
24h Range | $121.18 to $129.65 |
Market Cap | $1.898B |
Outstanding Token Value | $1.911B |
Fully Diluted Valuation | $1.969B |
24h Trading Volume | $267.857M |
Total Value Locked (TVL) | $17.878B |
Circulating Supply | 15.425M |
Outstanding Supply | 15.533M |
Total Supply | 16M |
Max Supply | 16M |
Source: $AAVE market cap data taken from CoinGecko, data as of Aug 31, 2026. Figures may vary slightly across other tracking websites.
Exchange Volume
Binance leads Aave futures volume by a comfortable margin at roughly $99.91M. BingX follows at $51.95M, notably skewed toward the sell side based on current positioning, while OKX and WhiteBIT sit close together at $37.09M and $38.21M. 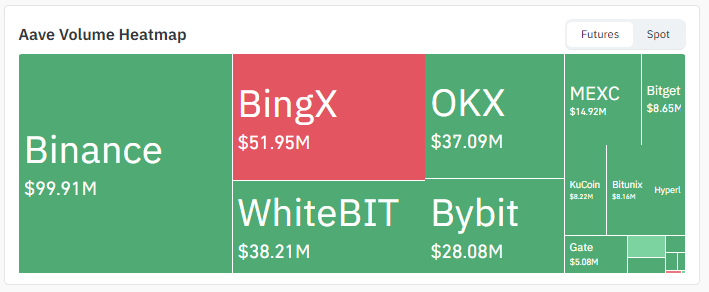
Source: Volume Heatmap Data Taken From Coinglass.
Bybit adds another $28.08M, with MEXC, Bitget, KuCoin, Bitunix, Hyperliquid, and Gate rounding out a broad spread of smaller venues.
This kind of multi-exchange liquidity generally supports cleaner price discovery, lending more weight to the technical levels being tracked in this Aave Price Prediction.
Liquidation Snapshot
Liquidation data over the past 24 hours shows $728.83K in total positions wiped out, with longs taking the bigger share at $535.08K against $193.76K in shorts.
The 12-hour window tells a similar story, with $485.27K in total liquidations split between $398.00K in longs and $87.27K in shorts. But the picture flips sharply in the shorter windows: 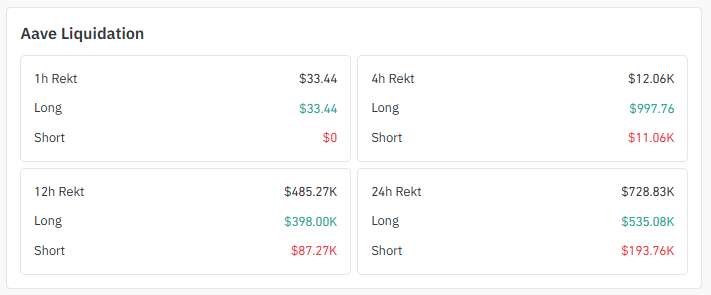
Source: Liquidation Data Taken From Coinglass.
The 4-hour window shows $12.06K in liquidations dominated by shorts at $11.06K against just $997.76 in longs, and the 1-hour window shows liquidations entirely on the long side at $33.44 with no short liquidations recorded.
That mix suggests longs have absorbed most of the pain across the full day, while a more recent squeeze has actually hit shorts harder in the very short term, a dynamic worth watching as this Aave Price Prediction plays out.
Key Takeaways
$AAVE is trading near $123.05, sitting inside a descending channel on the 4H chart while also tracing out a Wolfe Wave pattern.
A break above the channel's upper boundary lines up with the Wolfe Wave's projected level near $132.76, with $141.87 as a further resistance to watch.
A break of the support beneath the channel could send AAVE sliding toward $120.65 and potentially $109.47 if that level fails too.
Aave's Total Value Locked stands at a hefty $17.878B, well above its own market cap, which is a notable fundamental backdrop for this Aave Price Prediction.
Liquidation data shows longs taking the bigger hit over the past 24 hours, even as shorts absorbed most of the damage in the most recent hour.
Technical Analysis
On the 4H chart, $AAVE is currently trading inside a clearly defined descending channel, with the price compressing between a falling upper and lower boundary.
Within this same structure, the chart is also tracing out a Wolfe Wave pattern, a five-point formation that traders use to anticipate a sharp directional move once price breaks out of the range it defines. 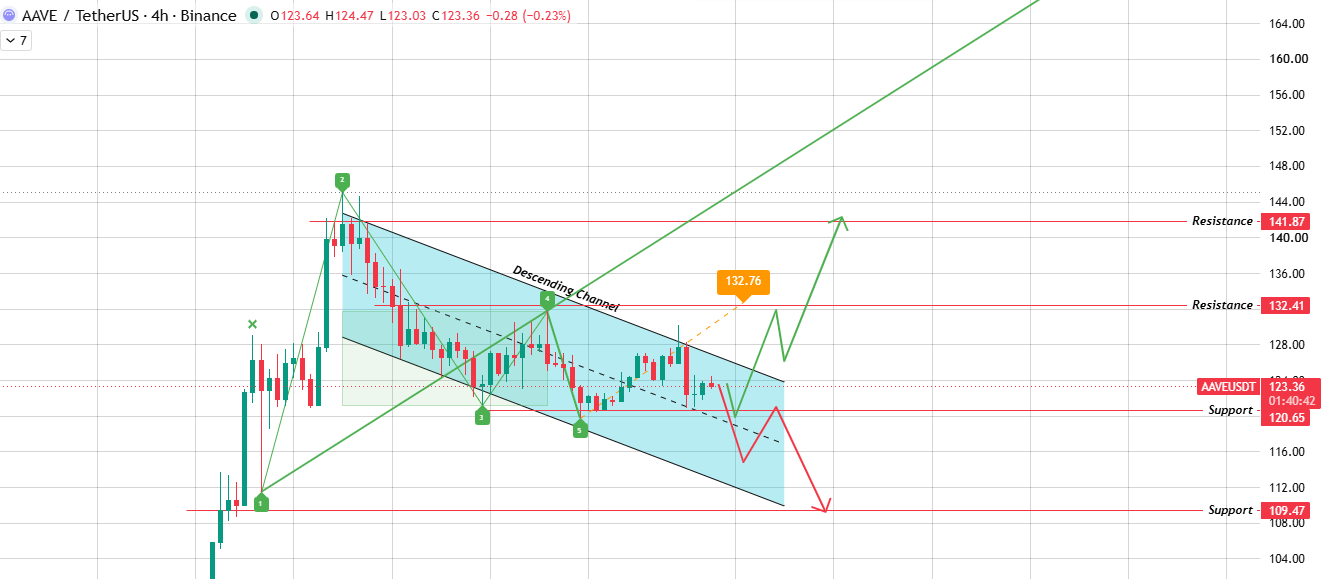
Source: Chart Taken From TradingView.
In this case, the pattern's projected level sits around $132.76, closely aligning with the $132.41 resistance level already visible on the chart.
If the price manages to break above the channel's upper boundary, the setup favors a move first toward that $132.41 to $132.76 zone, with $141.87 as the next resistance if momentum carries further.
On the other hand, if the price breaks below the channel's lower boundary and the $120.65 support fails to hold, the setup shifts bearish, opening a path down toward $109.47.
Wolfe Wave in Focus
The Wolfe Wave is the standout feature of this Aave Price Prediction.
This pattern typically forms when price oscillates within a converging or channel-like structure through five distinct swing points, and it's often used to project where price is likely to move once it breaks free of that structure.
Here, the projected level lines up closely with the channel's own upper resistance, which adds extra weight to the $132.41 to $132.76 zone as the level to watch on any confirmed breakout.
Descending Channel in Focus
Independent of the Wolfe Wave, the descending channel itself gives a simpler read on the setup.
As long as the price stays contained between its boundaries, the base case remains continued consolidation.
A decisive close above the upper boundary would be the clearest signal that buyers are taking control, while a decisive close below the lower boundary and the $120.65 support would tilt the setup toward the downside levels instead.
Support and Resistance Levels
Level Type | Price |
Resistance 2 | $141.87 |
Resistance 1 | $132.41 |
Wolfe Wave level | $132.76 |
Current Price | $123.36 |
Support 1 | $120.65 |
Support 2 | $109.47 |
Bull, Base, and Bear Case
Scenario | Level | Setup | Invalidation |
Bull | $132.41 to $141.87 | Price breaks the descending channel's upper boundary, confirming the Wolfe Wave breakout toward its projected level. | Rejection at $132.41 / $132.76 and drop back inside the channel |
Base | $120.65 to $128.00 | Price continues chopping inside the descending channel, unable to break either boundary decisively. | Break of either the channel's upper or lower boundary |
Bear | Below $120.65 | Channel support breaks, Wolfe Wave setup invalidated to the downside | Reclaim of $120.65 and the channel structure |
Expert Opinion
Analysts following this Aave Price Prediction see real significance in the overlap between the descending channel and the Wolfe Wave pattern, since both are pointing to a similar resistance zone around $132.41 to $132.76 as the key level to watch on a breakout.
Most technical voices want to see a confirmed close above the channel's upper boundary before getting more confident about a run toward $141.87, while acknowledging that a clean breakdown of the $120.65 support would quickly shift focus toward the $109.47 level instead.
The protocol's large TVL relative to its market cap is also cited as a supportive backdrop, even if it isn't treated as a standalone signal for near-term price direction.
Glossary
Descending Channel: A downward-sloping price structure formed by a series of lower highs and lower lows, reflecting consistent selling pressure.
Wolfe Wave: A five-point chart pattern that forms as price oscillates within a converging or channel-like range, commonly used to project a sharp breakout move once price exits that structure.
Total Value Locked (TVL): The total value of assets deposited or staked within a DeFi protocol, often used as a gauge of real usage and adoption.
Liquidation: The forced closing of a leveraged trading position when losses eat up a trader's margin, common in futures markets.
Support Level: A price zone where buying pressure has historically stepped in to slow or reverse a decline.
Resistance Level: A price zone where selling pressure has historically capped further gains.
Fully Diluted Valuation (FDV): The theoretical total market value of a coin if its entire max supply were in circulation today.
Methodology
This Aave Price Prediction is built using the 4H chart pattern, including the descending channel, the Wolfe Wave formation and its projected level, and marked support and resistance levels, combined with current market cap, TVL, exchange volume, and liquidation data.
All price levels referenced are taken directly from the chart provided and are not extrapolated beyond what the pattern shows.
Disclaimer: This article is for informational purposes only and should not be treated as financial advice. Cryptocurrency markets are highly volatile, and prices can move sharply in either direction within short periods. Always do your own research and consult a qualified financial advisor before making any investment decisions.
















