Bitcoin Cash Price Prediction: $BCH Rise 9% in 24Hr, Eyes $350 Levels?


Bitcoin Cash is on fire today. BCH has surged nearly 9% to trade near $231.36, and shorts are getting wrecked across every exchange as buyers move in.
The broader market is buzzing right now, and this Bitcoin Cash Price Prediction looks at whether BCH can keep this momentum going or whether the excitement cools off just as fast as it built up.
Market data was checked on August 21, 2026, at 10:49 IST.
Bitcoin Cash Price Prediction Today: Market Overview
Metric | Value |
Price | $231.36 |
24h Change | +9% |
Market Cap | $4.62B |
24h Change (Market Cap) | +9.12% |
24h Volume | $310.9M |
24h Change (Volume) | -45.78% |
Vol/Mkt Cap (24h) | 6.71% |
FDV | $4.84B |
Total Supply | 20.07M $BCH |
Max Supply | 21M BCH |
Circulating Supply | 20.07M $BCH |
Holders | 37.8K |
Source: Data from CoinMarketCap as of August 21, 2026, at 10:49 IST. Figures may vary slightly across other tracking websites.
Bitcoin's Rally and What It Means for $BCH
Bitcoin is trading near $75,300.28 after a strong daily gain of over 8.65%, strengthening the broader crypto market.
If BTC sustains this momentum, $BCH could benefit from increased risk appetite and potentially deliver a stronger percentage move, especially with shorts already getting squeezed on the $BCH chart.
Bitcoin Cash Liquidation and Volume Data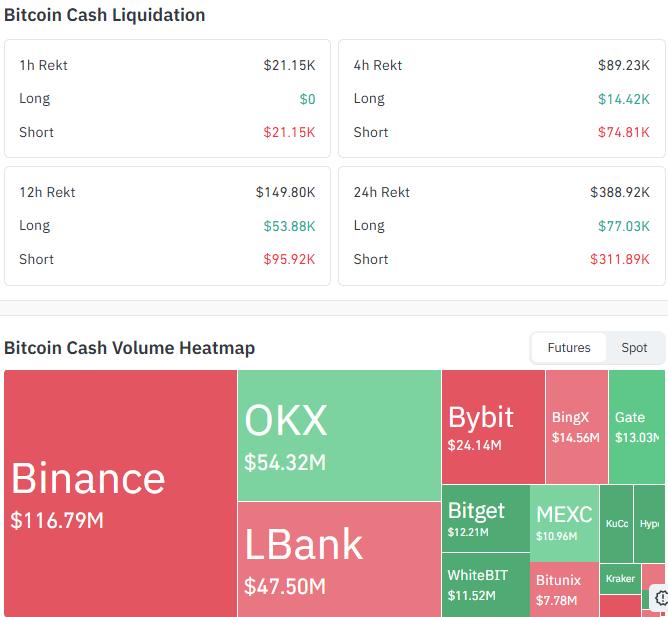
Source: Data From CoinGlass
Liquidations (Coinglass, Futures)
Timeframe | Total | Long | Short |
1h | $21.15K | $0 | $21.15K |
4h | $89.23K | $14.42K | $74.81K |
12h | $149.80K | $53.88K | $95.92K |
24h | $388.92K | $77.03K | $311.89K |
Exchange Volume (Futures)
Exchange | Volume |
Binance | $116.79M |
OKX | $54.32M |
Short liquidations have dominated every window, most heavily in the 1h and 24h windows, showing shorts getting squeezed as price pushed higher.
BCH Price Prediction Chart: Technical Analysis
Pair: BCH/USD · Market: Spot (Crypto) · Timeframe: 1D · Source: TradingView · Timestamp: August 21, 2026, 10:49 UTC+5:30
BCH trading at $231.36, after breaking above a descending trendline that had held since early July.
The breakout came with a strong candle that pushed price clear of the $222.57 zone, which now marks the first support level, with a deeper support at $216.90 below that.
RSI (14) sits at 67.45, showing strong momentum without being deeply overbought yet.
The nearest resistance sits at $240.12, with the EMA cluster below current price acting as support: the shorter EMA at $213.44 and the longer EMA at $221.81.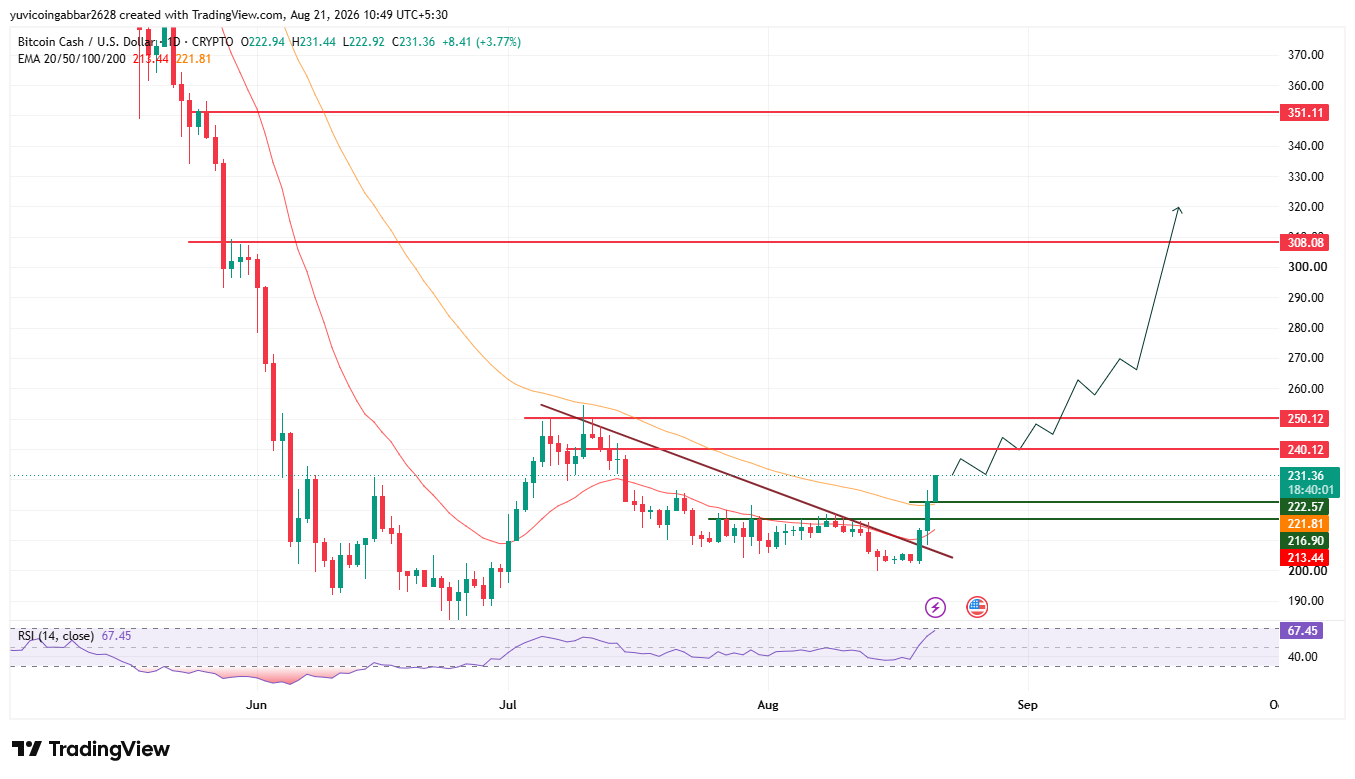
Importance Levels to watch
Level Type | Price |
Resistance 4 | $351.11 |
Resistance 3 | $308.08 |
Resistance 2 | $250.12 |
Resistance 1 (nearest) | $240.12 |
Immediate Price Reference | $231.36 |
Nearest Support (breakout zone) | $222.57 |
Deeper Support | $216.90 |
Bitcoin Cash Forecast: Bull Case vs. Bear Case
$BCH price target 2026 Bull case: Holding above the breakout zone at $222.57 and the EMA cluster near $213.44 to $221.81 keeps the trendline reversal intact.
A confirmed close above $240.12 would open the path toward $250.12 and eventually $308.08.
$BCH price target 2026 Bear case: A close back below $222.57 would put the breakout in doubt and suggest the rally was a short squeeze rather than a trend shift.
Losing $216.90 and the EMA cluster near $221.81 would expose $213.44 as the next level to hold.
Price Scenarios 2026: Triggers and Invalidation
Scenario | Trigger | Likely Outcome | Invalidation Point |
Trendline hold | Price stays above $222.57 | Push toward $240.12 | Close below $222.57 |
Resistance breakout | Close above $240.12 | Move toward $250.12, then $308.08 | Rejection back below $231.36 |
Pullback | RSI cools from 67.45 | Retest of EMA cluster $221.81 to $213.44 | Break below $213.44 |
$BCH price target: Can BCH Reach $351.11?
$351.11 is the highest resistance marked on the chart.
Reaching it would require BCH to first clear $240.12, then $250.12, then hold above $308.08, a multi-stage move rather than a single leg.
Bitcoin Cash Price Prediction: Expert View
According to CoinGabbar analysts, BCH just cleared a trendline that had pressured it lower since early July, and heavy short liquidations over the past 24 hours suggest part of this move is a squeeze rather than pure spot demand.
RSI at 67.45 leaves room to run before the chart looks stretched.
The $222.57 zone is now the key level: holding it keeps the breakout thesis alive, while losing it would suggest the move fades as fast as it started.
Disclaimer
This piece is for informational purposes only and is not financial advice. The levels and scenarios above are based on technical chart analysis and publicly available data at the time of writing. Crypto markets can move sharply within hours, so past patterns do not guarantee future outcomes. It is worth doing independent research and considering your own risk tolerance before acting on any of the levels discussed here.










.webp)






