Bitcoin Cash Price Prediction: $BCH $300 Soon, Biggest Breakout Yet?


Bitcoin Cash just broke above the trendline that capped every bounce since July, and this move looks too big to ignore.
This Bitcoin Cash Price Prediction checks if this is the biggest breakout of the cycle, bullish above $210, or in doubt below it.
Market data was checked on August 20, 2026, at 10:54 IST.
Bitcoin Cash Price Prediction Today: Market Overview
| Metric | Value |
| Price | $211.86 |
| 24h Change | +4.42% |
| Market Cap | $4.25B (+4.42%) |
| FDV | $4.44B |
| 24h Volume | $575M+ (up 322.74%) |
| Vol/Mkt Cap (24h) | 13.5% |
| Total Supply | 20.07M BCH |
| Max Supply | 21M BCH |
| Circulating Supply | 20.07M BCH |
| Holders | 37.78K |
Source: Data from CoinMarketCap as of August 20, 2026, at 10:54 IST. Figures may vary slightly across other tracking websites.
Bitcoin Cash Liquidation and Volume Data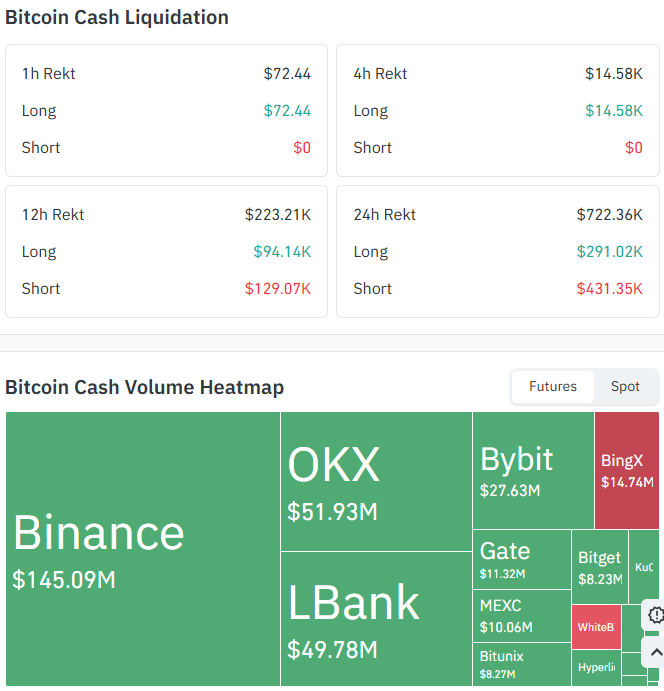
Source: Data From CoinGlass
Longs took the pain on shorter timeframes, then shorts got squeezed as the breakout extended.
| Timeframe | Total Rekt | Long | Short |
| 1h | $72.44 | $72.44 | $0 |
| 4h | $14.58K | $14.58K | $0 |
| 12h | $223.21K | $94.14K | $129.07K |
| 24h | $722.36K | $291.02K | $431.35K |
Futures Volume by Exchange (24h)
| Exchange | Volume |
| Binance | $145.09M |
| OKX | $51.93M |
The 24h total of $722.36K skews toward shorts at $431.35K versus $291.02K longs.
$BCH Price Prediction Chart: Technical Analysis
Pair: BCH/USD · Market: Spot (Crypto index) · Timeframe: 1D · Source: TradingView · Timestamp: August 20, 2026, 10:54 UTC+5:30
$BCH closed at $211.86, but the bigger story is the trendline break held since the July high near $250.
Price could confirm the breakout with a sustained close above the $216 resistance.
Holding this level as support would strengthen the bullish setup and potentially open the path for further upside.
RSI (14) sits at 49.91, neutral, leaving room to run. Price sits above $EMA 20 at $210.49 and below $EMA 50 at $220.98; reclaiming $EMA 50 confirms the trend shift.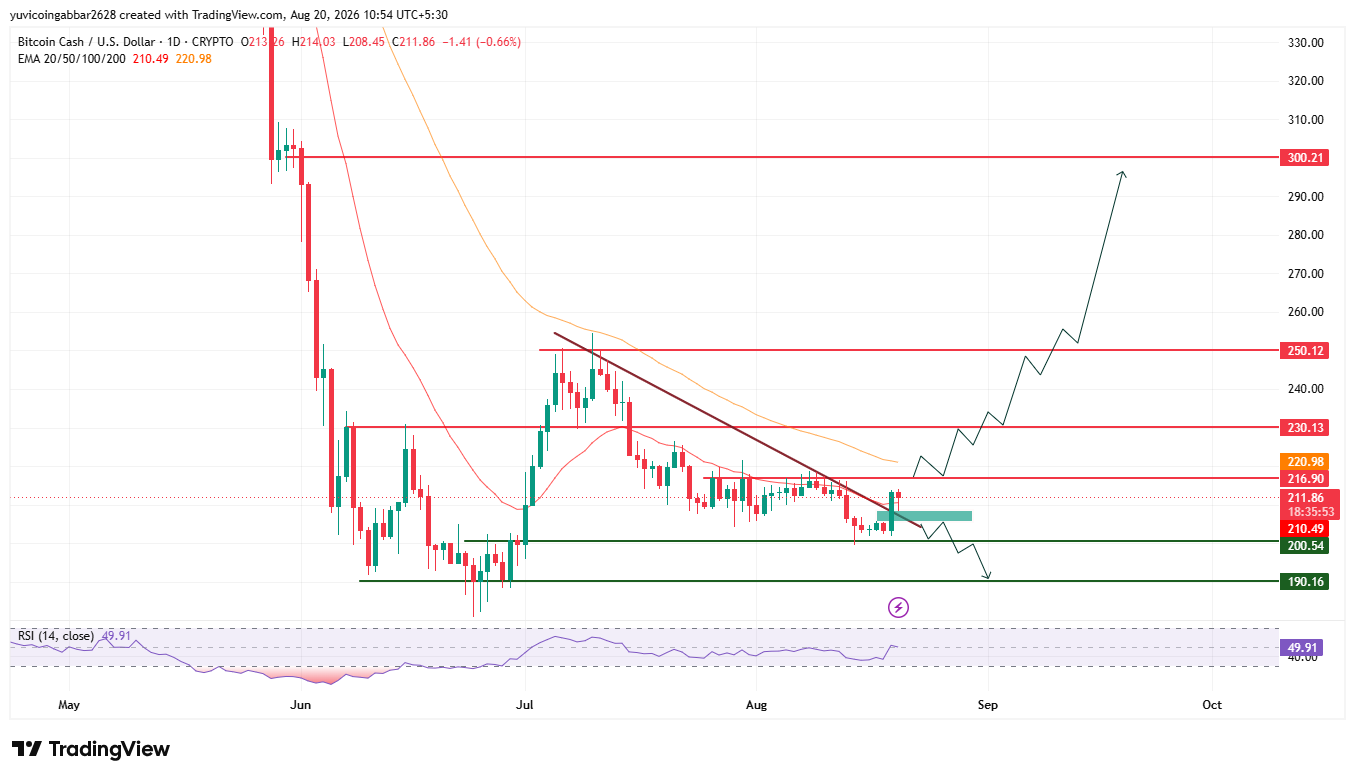
BCH Key Price Levels Before the Next Big Move
| Level Type | Price |
| Resistance 4 | $300.21 |
| Resistance 3 | $250.12 |
| Resistance 2 | $230.13 |
| Resistance 1 (nearest) | $216.90 |
| Immediate Price Reference | $211.86 |
| Support | $200.54 |
| Support | $190.16 |
$BCH Trendline Breakout: EMA Levels
| EMA | Price |
| EMA 20 | $210.49 |
| EMA 50 | $220.98 |
EMA 20 sits right on the nearest support at $210.49, the key zone to hold.
Bitcoin Cash Forecast: Bull Case vs. Bear Case
$BCH price target 2026 Bull case: Holding above $210.49 and clearing $EMA 50 at $220.98 confirms a genuine trend shift, opening the path toward $216.90, $230.13, $250.12, and $300.21 longer term.
$BCH price target 2026 Bear case: A close below $200.54 suggests a fakeout. Losing $200.54 exposes $190.16 next.
Price Scenarios 2026: Triggers and Invalidation
| Scenario | Trigger | Likely Outcome | Invalidation Point |
| Trendline reclaim | Hold above the broken trendline near $211 | Push toward $216.90, then $230.13 | Close below $200.54 |
| Channel hold | Price stays above $210.49 | Range continuation toward $216.90 | Break below $200.54 |
| Channel breakdown | Break below $200.54 | Drop toward $190.16 | Reclaim above $210.49 |
$BCH price target Long-Term: Can $BCH Reach $300?
$300.21 is the highest resistance on the chart, lining up with June's high.
Getting there needs $BCH to clear $216.90, $230.13, and $250.12 in turn.
What Could Invalidate the Bullish Setup?
A rejection at $216.90 followed by a close below $200.54 and $EMA 20 puts the breakout in doubt.
A deeper break below $190.16 breaks the recovery entirely.
Bitcoin Cash Price Prediction: Expert Analysis
According to CoinGabbar analysts , the trendline break plus neutral RSI gives $BCH room to run. $200.54 is the level that decides everything: hold it, and the breakout stays real.
Disclaimer: This piece is for informational purposes only and is not financial advice. The levels above are based on technical chart analysis and publicly available data at the time of writing, and crypto markets can move sharply, so past patterns do not guarantee future outcomes. Do your own research before acting on any level discussed here.
Also read:







.webp)








