Bitcoin Cash Price Prediction: $BCH Next Move After Breaking Out?


$BCH just ripped out of a months-long slide and traders are watching closely to see if it holds.
This Bitcoin Cash price prediction looks at whether BCH can keep pushing higher or cool off first, with the bullish case staying alive above $240 over the next few sessions, while a break below that level opens the door to a pullback.
Here's what the numbers show right now.
Market data was checked on August 31, 2026, at 11:03 IST.
Bitcoin Cash Price Prediction Today: Market Overview
Metric | Value |
Price | $246.90 |
24h Change | +0.61% |
Market Cap | $4.96B (+0.79%) |
FDV | $5.18B |
24h Volume | $122.3M+ (up 62.34%) |
Vol/Mkt Cap (24h) | 2.46% |
Total Supply | 20.08M BCH |
Max Supply | 21M BCH |
Circulating Supply | 20.08M BCH |
Holders | 37.94K |
Source: Data from CoinMarketCap as of August 31, 2026, at 11:03 IST. Figures may vary slightly across other tracking websites.
BCH Liquidation and Volume Data
Window | Total Rekt | Long | Short |
1h | $6.85K | $4.88K | $1.98K |
4h | $11.76K | $8.18K | $3.58K |
12h | $584.08K | $571.09K | $12.99K |
24h | $624.06K | $574.34K | $49.72K |
This is Coinglass futures data, kept separate from the spot volume above.
Longs have taken the bulk of the liquidations over the past 12 to 24 hours, showing leveraged buyers got squeezed as the price cooled off after its breakout candle.
On futures volume, Binance leads at $69.21M, followed by OKX at $30.70M, LBank at $30.66M, WhiteBIT at $19.12M, BingX at $15.73M, Bybit at $13.75M, Bitget at $9.57M, Gate at $5.87M, Bitunix at $4.75M, KuCoin at $4.60M, and MEXC at $3.70M.
BCH Price Prediction Chart: Technical Analysis
Pair: BCH/USD · Market: Spot (Crypto) · Broker Feed: OANDA · Timeframe: 1D · Source: TradingView · Timestamp: August 31, 2026, 11:03 UTC+5:30
BCH is trading at $246.90, after breaking sharply out of a descending channel that had held since July.
A large bullish candle drove the breakout, and price has since cooled into a tight consolidation just above the $240.08 support, right where its EMA cluster sits close by.
If the price respects the current level, holds support, and forms a base, it could move higher.
However, a break below the $217 level could create a bearish setup.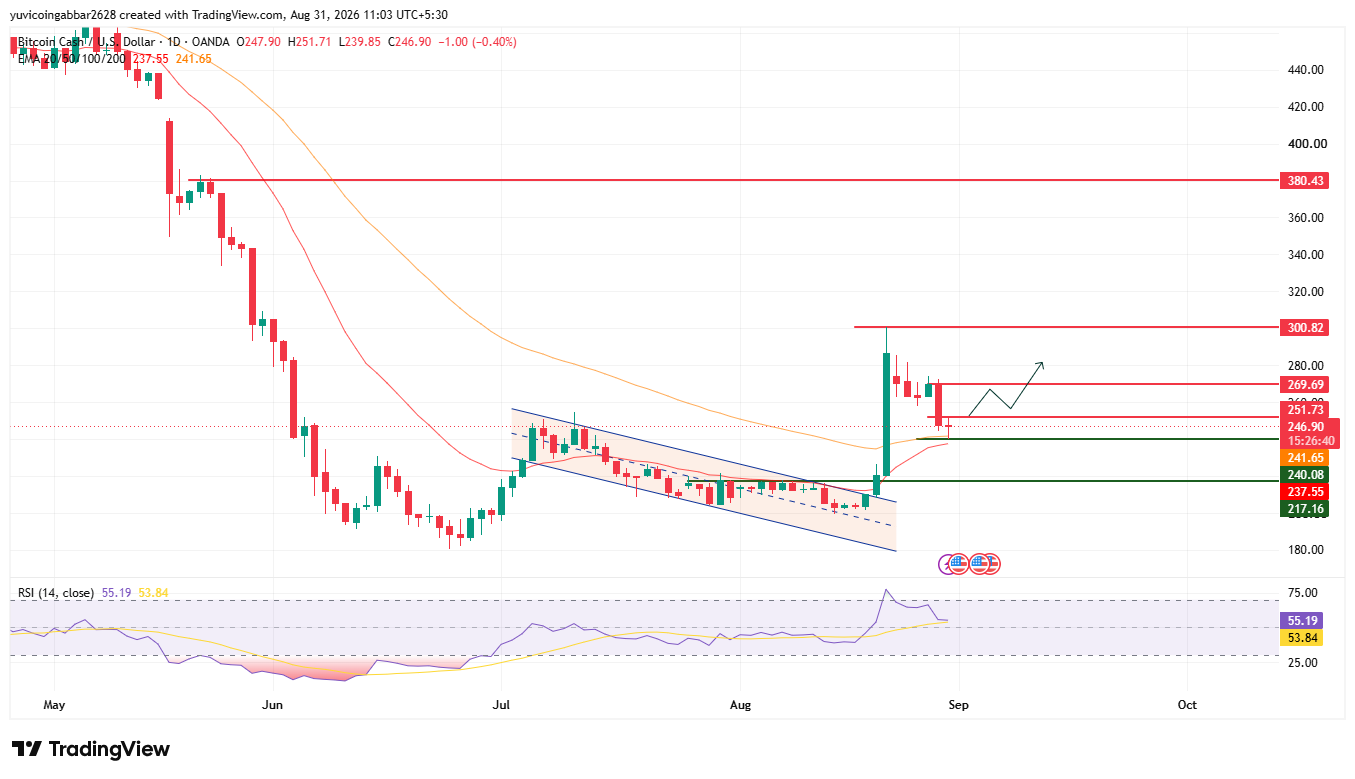
Bitcoin Cash Price Prediction: Key Levels
Level Type | Price |
Resistance 4 | $380.43 |
Resistance 3 | $300.82 |
Resistance 2 | $269.69 |
Resistance 1 (nearest) | $251.73 |
Immediate Price Reference | $246.90 |
First Confirmed Support | $240.08 |
Deeper Support | $217.16 |
Bitcoin Cash Forecast: Bull Case vs Bear Case
Bull case: A daily close above the nearest resistance at $251.73 would confirm the breakout is extending rather than fading, opening a path toward $269.69 and eventually $300.82 if momentum holds.
Bear case: Losing the $240.08 support and the EMA cluster between $237.55 and $241.65 would put the breakout in doubt, exposing $217.16 as the next downside level.
BCH Price Scenarios: Triggers and Invalidation
Scenario | Trigger | Likely Outcome | Invalidation Point |
Breakout continuation (bullish) | Daily close above $251.73 | Move toward $269.69, then $300.82 | Close back below $246.90 |
Channel hold | Price holds above $240.08 | Consolidation before the next push | Break below $240.08 |
Channel breakdown (bearish) | Daily close below $240.08 | Drop toward $217.16 | Reclaim above $240.08 |
Can BCH Reach $380.43?
$380.43 is the highest resistance marked on the chart.
Getting there would take multiple stages: clearing the nearest resistance at $251.73, then $269.69 and $300.82, before BCH even approaches that level.
Bitcoin Cash Price Prediction: Expert View
According to CoinGabbar analysts, BCH's breakout out of its multi-month channel is the standout move here, and the mostly long-side liquidations suggest leveraged buyers, not spot demand, are driving the pullback from the breakout candle.
The $240.08 to $251.73 zone is the one to watch: holding it keeps the breakout thesis intact.
Disclaimer
This piece is for informational purposes only and isn't financial advice. The levels and scenarios above are based on technical chart analysis and publicly available data at the time of writing, and crypto markets can move sharply within hours, so past patterns don't guarantee future outcomes. It's worth doing independent research and considering your own risk tolerance before acting on any of the levels discussed here.
Also read:
















