Ethereum Price Prediction: Breakout or Breakdown After Whale Alert?


Ethereum price prediction watchers have a genuine coin-flip setup on their hands right now.
ETH has been boxed inside a tight range for more than a week, sweeping liquidity on both sides without giving traders a clean signal either way.
A fresh whale transaction just added new weight to the debate, and the exchange flow data lining up behind it could tip the balance in either direction.
Whichever side of this range breaks first is likely to decide the next leg for the asset. Here is everything currently on the chart.
Ethereum Price Today and Live Market Data
$ETH is trading at $2,433.8, down $20.865, or 0.85 percent, over the past 24 hours.
Futures volume over the last 24 hours sits at $49.16 billion, with spot volume at $2.30 billion.
Market capitalization is holding near $292.63 billion, and open interest across derivatives stands at $32.19 billion.
Circulating supply is 120.68 million ETH, matching total supply, since Ethereum does not carry a fixed max supply cap the way some other assets do.
This live snapshot sets the backdrop for the rest of this ETH price outlook.
Source: CoinGlass, Ethereum market data, August 31, 2026.
Ethereum Latest News and Whale Activity
The biggest Ethereum news of the day comes from the on-chain tracker.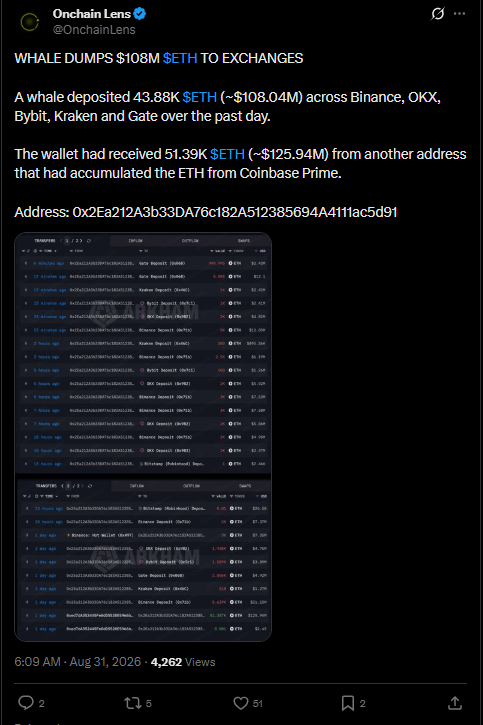
Onchain Lens, which flagged a large wallet moving 43.88K ETH, worth roughly $108.04 million, across Binance, OKX, Bybit, Kraken, and Gate over the past day.
The same wallet had earlier received 51.39K ETH, worth close to $125.94 million, from another address that had built its position from Coinbase Prime.
Large deposits spread across multiple exchanges like this are typically watched closely, since they often precede selling activity rather than simple custody moves.
Source: Onchain Lens on X, August 31, 2026, 6:09 AM.
Ethereum Spot ETF Flow Data Stays Net Positive
Ethereum spot ETF flows have stayed in net inflow territory for over a week straight. 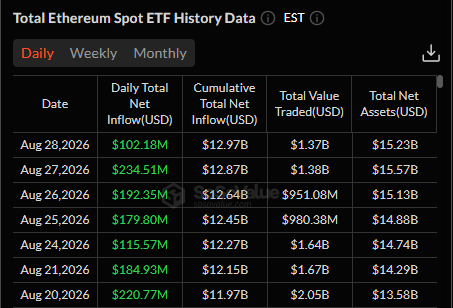
On August 28, daily net inflow came in at $102.18 million, pushing cumulative net inflow to $12.97 billion.
That follows $234.51 million on August 27, $192.35 million on August 26, $179.80 million on August 25, and $115.57 million on August 24.
Total net assets across Ethereum ETFs have climbed from $13.58 billion on August 20 to $15.23 billion by August 28, showing steady institutional demand even as the whale deposit above points the other way on the retail and derivatives side.
Source: SoSoValue, Ethereum Spot ETF flow data, August 31, 2026.
Quick Take
CMP: $2,431.12 (4-hour Binance ETH/USDT perpetual chart)
4-hour trigger level: close above $2,565.49 opens upside toward $2,716.12 and $2,877.42
4-hour failure level: close below $2,355.83 shifts focus toward $2,221.27
Data timestamp: August 31, 2026, 10:53 UTC+5:30
Risk note: liquidity has already been swept on both sides of the range, so the first move can still fake out before the real breakout confirms
Ethereum Technical Analysis Shows a Liquidity-Swept Range
On the 4-hour timeframe, ETH is currently trading inside an accumulation zone bounded by $2,565.49 on the upper end and $2,355.83 on the lower end.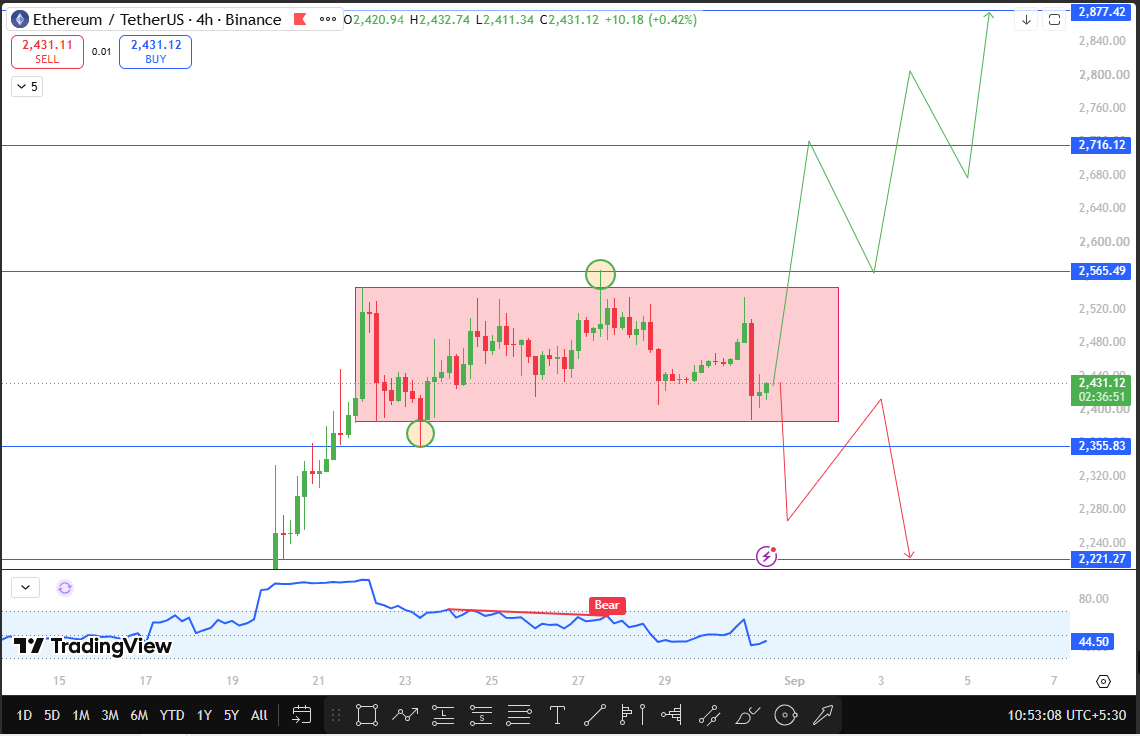
Price has already swept liquidity on both sides of this range without producing a decisive breakout, which is a common precursor to a sharper directional move once one side finally gives way.
CMP is the current market price, sitting at $2,431.12, roughly in the middle of the range.
If the price breaks and closes above $2,565.49 on the 4-hour chart, the next resistance to track is $2,716.12, followed by $2,877.42 as the extended target for this Ethereum breakout prediction.
If the price instead breaks and closes below $2,355.83, the next support to watch is $2,221.27.
The momentum reading (RSI) on the chart is currently tagged bearish near the 44.50 mark, a modest lean that lines up with the whale deposit activity but is not strong enough on its own to call direction with confidence.
Traders should treat whichever side breaks first, with volume that clearly exceeds the recent swing candles, as the more reliable signal, given how much liquidity has already been swept in this Ethereum technical analysis setup.
Source: TradingView, Ethereum/TetherUS perpetual contract, 4-hour chart, Binance, August 31, 2026, 10:53 UTC+5:30.
Ethereum Support and Resistance Levels for This Setup
Level Type | Price | Distance from CMP |
Resistance 2 (Extended Target) | $2,877.42 | +18.36% |
Resistance 1 | $2,716.12 | +11.72% |
Range High (Trigger) | $2,565.49 | +5.53% |
CMP | $2,431.12 | — |
Range Low (Failure) | $2,355.83 | -3.10% |
Support 1 | $2,221.27 | -8.63% |
Ethereum Price Outlook: Bull, Base, and Bear Scenarios
In the bull case, ETH closes above $2,565.49 on the 4-hour chart with volume clearly above the recent range candles.
That confirms a genuine breakout rather than another liquidity sweep, opening a path toward $2,716.12 and then $2,877.42.
In the base case, ETH keeps rotating inside the $2,355.83 to $2,565.49 range, sweeping liquidity on either side without a confirmed close beyond either boundary, while the market digests the whale deposit and waits for the next clear signal.
In the bear case, ETH breaks and closes below $2,355.83, confirming a breakdown from the accumulation zone and opening the path toward $2,221.27, a move that would align with the exchange-deposit pressure flagged in the news section above.
Risks to This Ethereum Price Prediction
The main risk here is a false breakout, since both sides of this range have already seen liquidity swept once without a sustained move following through.
A close beyond either boundary needs strong volume confirmation before it should be treated as the real move, not just another sweep.
The large exchange deposit adds near-term selling risk, though it needs to be weighed against the steady ETF inflows still showing on the institutional side.
Any sharp reversal in that ETF inflow trend, or a broader shift in risk appetite across crypto majors, could also override the current chart structure.
Glossary
Accumulation Zone: A price range where an asset trades sideways while buyers and sellers build positions before a larger directional move.
Liquidity Sweep: A brief price move beyond a recent high or low that triggers stop orders before reversing, often used to describe stop hunts near range boundaries.
Spot ETF Flow: The daily net amount of money moving into or out of spot exchange-traded funds tracking an asset's price.
CMP: Current market price, the live trading price of an asset at the time of analysis.
Disclaimer
This article is for informational purposes only and should not be treated as financial advice. Cryptocurrency markets are highly volatile, and readers should conduct their own research before making any investment decisions.
Also read:
















