Shiba Inu Price Prediction: Can $SHIB Explode After 873% Burn Spike?

Shiba Inu started out in 2020 as a dog-themed meme token built to rival Dogecoin, and it grew into one of the most widely held cryptocurrencies thanks to a massive community and an equally massive token supply.
Today, $SHIB is trading around $0.00000501, down 2.3 percent over the last 24 hours, as traders weigh fresh burn rate news against the coin's usual meme-driven swings.
Despite its low unit price, SHIB has held a spot among the top cryptocurrencies by market cap for years, and this Shiba Inu Price Prediction looks at where it could be headed next.
Live Market Data
Metric | Value |
Price | $0.00000501 (-2.3%) |
24h Range | $0.000004905 to $0.000005232 |
Market Cap | $2.957B |
Fully Diluted Valuation | $2.958B |
24h Trading Volume | $79.982M |
Circulating Supply | 589.239T |
Total Supply | 589.496T |
Source: $SHIB market cap data taken from Coingecko, data as of Aug 31, 2026. Figures may vary slightly across other tracking websites.
Exchange Volume
LBank currently leads Shiba Inu futures volume at roughly $20.76M, followed by OKX at $13.09M. MEXC, Bitget, and Bitunix round out the next tier at $5.33M, $4.23M, and $3.23M.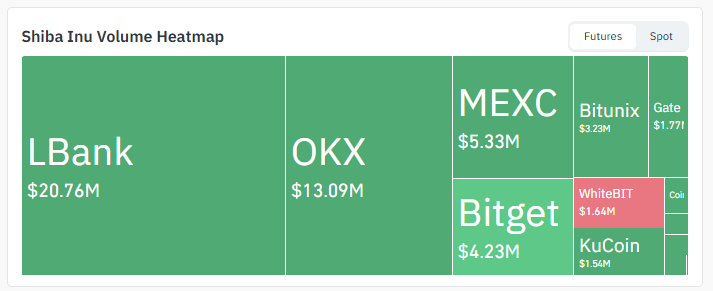
Source: Volume Heatmap Data Taken From Coinglass.
Respectively, with smaller amounts spread across WhiteBIT and KuCoin, showing that SHIB liquidity is fairly concentrated on a handful of exchanges.
That concentration matters for a coin like SHIB, since a large share of volume sitting on one or two venues can make short-term price swings sharper whenever a burst of buying or selling shows up, something worth keeping in mind while tracking this Shiba Inu price prediction.
Liquidation Snapshot
Liquidation activity has been light and heavily one-sided lately.
Over the past 24 hours, $185.04K in total positions were liquidated, with $162.65K coming from longs against just $22.39K in shorts. 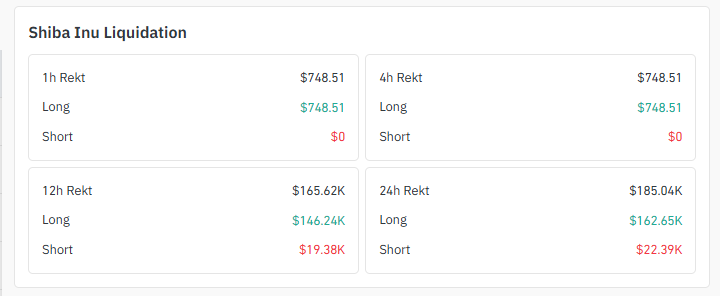
Source: Liquidation Data Taken From Coinglass.
The shorter 1-hour and 4-hour windows show an even more lopsided picture, with $748.51 wiped out entirely from long positions and effectively nothing from shorts, suggesting sellers have had the upper hand in the very short term even as the bigger structure stays intact.
It is worth noting the total dollar amounts here are small compared to bigger cap coins, which fits $SHIB's low unit price and reflects how leveraged trading on this token tends to move in much smaller absolute numbers even when the percentage swings feel large.
Shiba Inu New Today
SHIB's burn mechanism has been in the spotlight again, and it is driving a good chunk of the community buzz right now.
A widely circulated report noted that Shiba Inu's burn rate rocketed 873 percent in a single day, with 20.82 million $SHIB tokens destroyed in the process, a headline that quickly spread across crypto social media.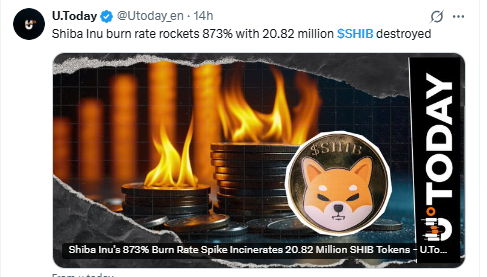
Source: Data Taken From @Utoday_en, X Account.
Burn rate spikes like this tend to grab attention because they reduce circulating supply, even if the actual price impact of any single burn event is usually small given SHIB's enormous total supply.
Even so, traders following this Shiba Inu price prediction are watching whether the renewed burn narrative can add extra support to the current FVG test.
Key Takeaways
SHIB is trading near $0.000005016, sitting inside a daily ascending channel and now testing the FVG zone left behind by an earlier sharp move.
A volume-backed bounce off this FVG that clears the channel's upper boundary could send SHIB toward the $0.00000623 to $0.00000784 resistance band.
Failure to hold the FVG bounce and a break of the channel's lower boundary could open the door toward the $0.00000462 support and lower.
Shiba Inus' burn rate reportedly spiked 873 percent in a single day, with 20.82 million SHIB tokens destroyed, adding a fresh angle to this Shiba Inu price prediction.
Liquidation data shows longs taking almost all the recent hits, with barely any short-side liquidations over the past 24 hours.
Shiba Inu Technical Analysis
On the daily chart, $SHIB is moving inside a clean ascending channel that has held since the recent low.
Price is now sitting right at the FVG zone left behind by an earlier sharp rally, a gap in trading activity that price often revisits before deciding its next direction. 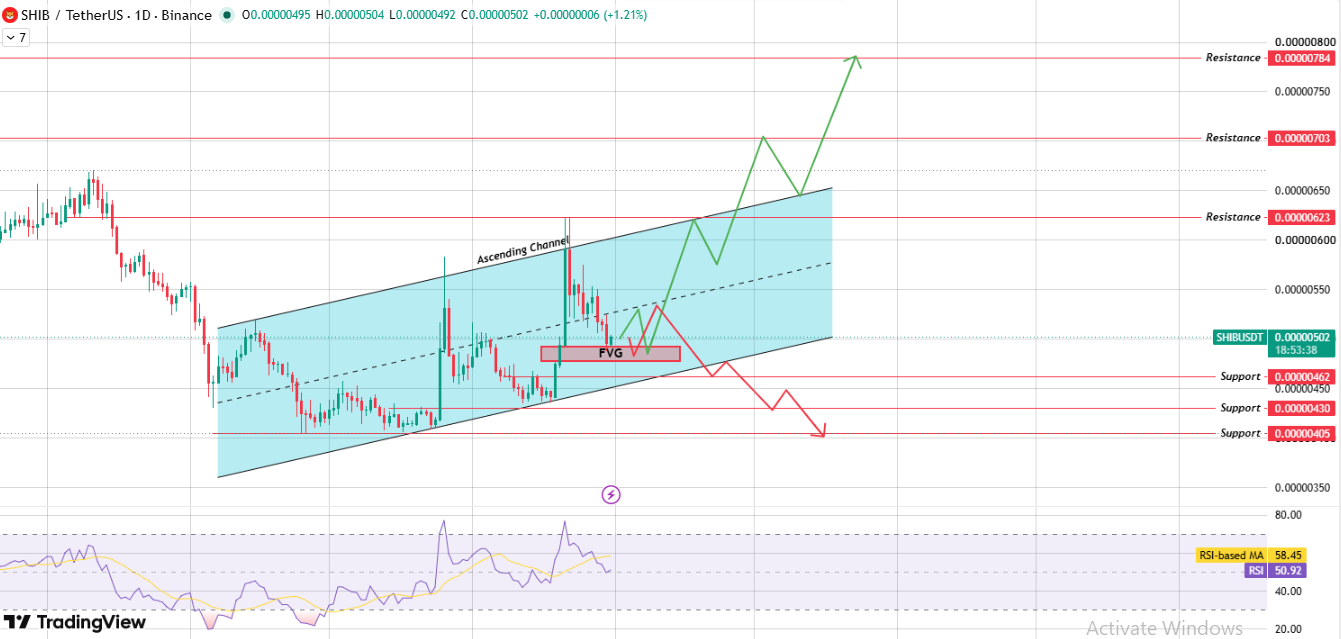
Source: Chart Taken From TradingView.
RSI is reading 50.92, just below its own moving average of 58.45, putting momentum in a fairly neutral spot as this FVG test plays out.
FVG Zone in Focus
The FVG, or fair value gap, sitting inside the channel is the level to watch right now. If buyers step in here with real volume and the price manages to clear the channel's upper boundary.
The setup opens toward the $0.00000623 resistance first, with $0.00000703 and $0.00000784 as the next level in this Shiba Inu Price Prediction.
If the bounce off the FVG fails to hold and the price slips back down through the channel's lower boundary instead, $SHIB could slide toward the $0.00000462 support, with $0.00000430 and $0.00000405 as the next levels if selling pressure continues.
Support and Resistance Levels
Level Type | Price |
Resistance 3 | $0.00000784 |
Resistance 2 | $0.00000703 |
Resistance 1 | $0.00000623 |
Current Price | $0.00000502 |
Support 1 | $0.00000462 |
Support 2 | $0.00000430 |
Support 3 | $0.00000405 |
Bull, Base, and Bear Case
Scenario | Level | Setup | Invalidation |
Bull | $0.00000623 to $0.00000784 | FVG holds, volume returns, and price clears the channel's upper boundary. | Rejection at the upper boundary and drop back into the channel |
Base | $0.00000462 to $0.00000623 | Price continues testing the FVG zone inside the ascending channel. | Break of either the channel top or bottom with strong volume |
Bear | $0.00000405 to $0.00000462 | FVG bounce fails, and the price breaks the channel's lower boundary. | Reclaim of $0.00000462 and channel structure |
Expert Opinion
Analysts watching this Shiba Inu price prediction are largely taking a wait-and-see approach.
The daily chart structure still favors buyers as long as the ascending channel holds, and the FVG test happening right now is viewed as a fairly normal pause rather than a warning sign on its own.
The burn rate spike adds a mildly bullish narrative, but most technical voices agree that a real breakout needs volume confirmation above the channel's upper boundary before SHIB can seriously threaten the higher resistance levels on this chart.
Glossary
Ascending Channel: A chart pattern formed by two parallel upward-sloping trendlines, where price tends to bounce between the upper and lower boundaries.
FVG (Fair Value Gap): A zone on the chart where price moved so fast that it left a gap in normal trading activity, which price often returns to test before continuing its trend.
RSI: Relative Strength Index, a momentum indicator measuring how fast and how much price has moved recently, typically read on a scale of 0 to 100.
Liquidation: The forced closing of a leveraged trading position when losses eat up a trader's margin, common in futures markets.
Support Level: A price zone where buying pressure has historically stepped in to slow or reverse a decline.
Resistance Level: A price zone where selling pressure has historically capped further gains.
Market Cap: The total value of all coins in circulation, found by multiplying price by circulating supply.
Methodology
This Shiba Inu price prediction is built using the daily chart pattern, including the visible ascending channel, the marked FVG zone, support and resistance levels, and RSI readings, combined with current exchange volume and liquidation data.
All price levels referenced are taken directly from the chart provided and are not extrapolated beyond what the pattern shows.
Market sentiment context is drawn from recent public reporting on Shiba Inu's burn rate activity.
Disclaimer: This article is for informational purposes only and should not be treated as financial advice. Cryptocurrency markets are highly volatile, and prices can move sharply in either direction within short periods. Always do your own research and consult a qualified financial advisor before making any investment decisions.
















