Bitcoin Cash Price Prediction: Is BCH Ready To Rebound?


Bitcoin Cash price prediction is back in focus after $BCH tried to break free of a downtrend, only to get pulled straight back toward the same support zone it had just escaped.
The breakout failed to sustain, but the way the price behaved on the way back down is what traders are now watching closely.
Quick Take: $BCH is trading near $211.50. This is a short-term read based on the 4-hour chart and should be rechecked if the price closes decisively beyond either $226.80 or $200. 6.
Bitcoin Cash Price Right Now
| Metric | Value |
| Price | $211.50 |
| 24h Change | -3.04% (-$6.6262) |
| Market Cap | $4.24B |
| Futures Volume (24h) | $163.57M |
| Spot Volume (24h) | $14.75M |
| Open Interest | $301.07M |
| Circulating Supply | 20.06M BCH |
| Total Supply | 20.06M BCH |
| Max Supply | 21.00M BCH |
Price taken from the live TradingView chart, with volume, market cap, open interest, and supply figures from Bitcoin Cash data on CoinGlass, as of July 24, 2026, around 9:45 AM IST.
For the full live breakdown, our Bitcoin Cash price prediction hub tracks these numbers continuously.
Methodology And Data Sources
This Bitcoin Cash price prediction uses the 4-hour BCH/USDT chart on Binance via TradingView for price structure, with volume, open interest, and market cap figures from CoinGlass and liquidation flow from CoinGlass's BCH liquidation tracker.
All levels are treated as invalidated only on a confirmed candle close beyond the stated trigger, not an intraday wick.
This is a short-term, intraday read and is not intended as a long-term Bitcoin Cash price forecast.
Why Is $BCH Down Today
Bitcoin fell yesterday as well, and that weakness spread across the wider market, $BCH included.
$BCH had managed a breakout attempt but could not sustain it, and the price has now slipped back into the same support zone it had recently left behind.
RSI on the chart is also trending lower, matching the pullback in price. That said, a return of buying pressure out of this support zone is still possible if Bitcoin moves higher or simply holds steady here.
For that kind of recovery to broaden out across altcoins like $BCH, Bitcoin dominance would generally need to ease off as well.
Bitcoin Cash Liquidation Data Today
Liquidation activity over the past day leans firmly toward longs getting caught out, even though the shortest window tells a different story.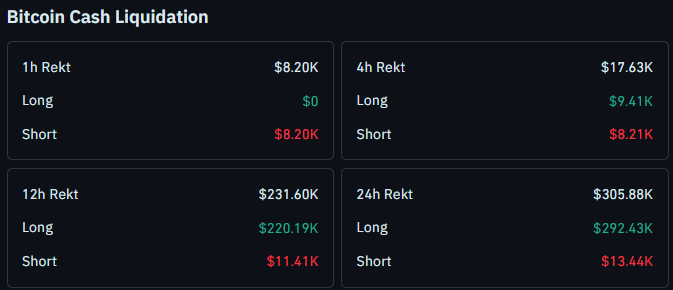
Over the past hour, $8.20K was liquidated, and all of it, $8.20K, came from short positions, with zero long liquidations in that window.
The picture flips on wider timeframes. The 4-hour figure shows $17.63K in total liquidations, made up of $9.41K in longs and $8.21K in shorts, a fairly even split.
Over 12 hours, the total jumps to $231.60K, with $220.19K from longs and just $11.41K from shorts.
Across the full 24 hours, liquidations reach $305.88K, and longs account for $292.43K of that figure, while shorts make up the remaining $13.44K.
The heavy day-long skew toward long liquidation lines up with the sharp reversal after the failed breakout, while the short-lived flip in the 1-hour window hints that late sellers are the ones getting caught out closer to the current price.
A full breakdown is available through the BCH critical support test coverage on CoinGlass liquidation data.
Bitcoin Cash Price Prediction: 4-Hour Chart Analysis
On the 4-hour chart, $BCH had been falling in a fairly disciplined way, respecting a descending trendline through repeated tests.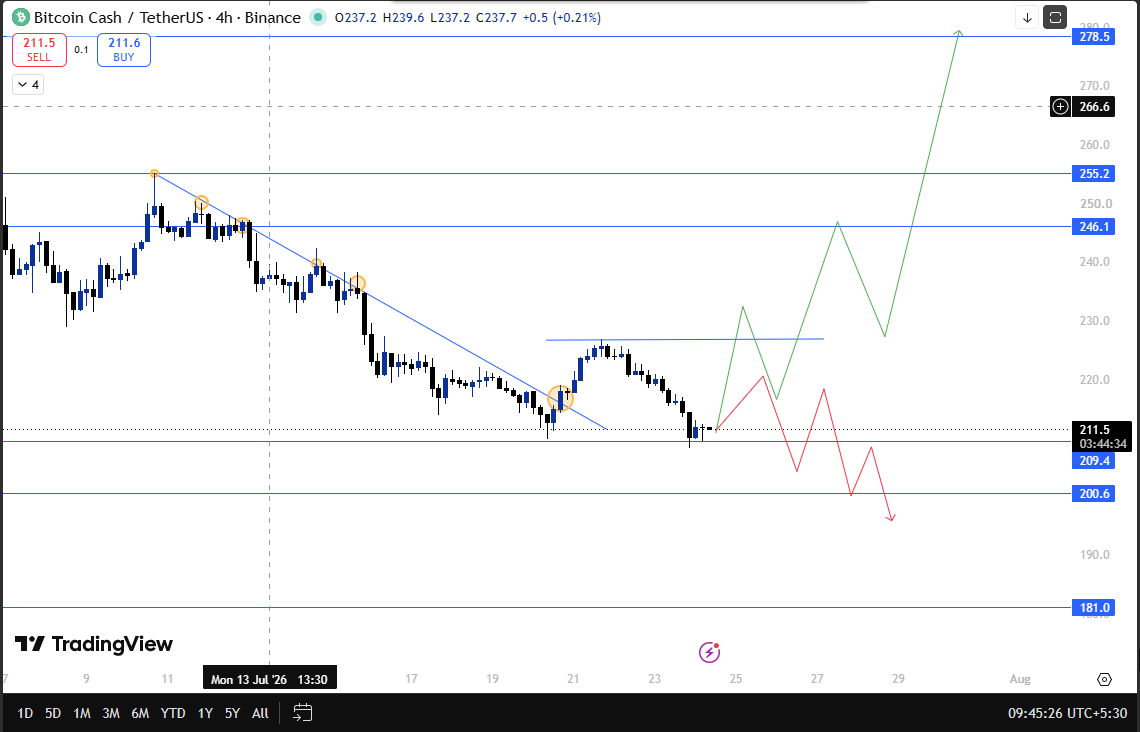
Each tap against that line pushed the price further down, and this rhythm held through five separate touches.
After the fifth tap, the price broke the trendline outright and fell sharply from the $226.8 zone, slicing straight through the recent swing low.
Sellers looked to be back in full control at that point, but the move did not stick.
Price rejected off the lows and closed back above that broken swing low, which is a meaningful tell; it suggests buyers stepped back in exactly where it mattered, similar to the defense covered in our BCH breakout watch analysis.
The bigger question now is whether that rejection turns into a real recovery or just another pause before more downside.
A confirmed close back above $226.8 would be the clearest sign sellers have lost the structure again, opening the path toward $246.1, then $255.2, and $278.5 further out.
If price instead fails to build on this bounce, a confirmed close below $200.6 would flip the setup bearish, with $181 next in view.
Bitcoin Cash Technical Snapshot
| Indicator | Signal |
| Trend | The descending trendline broken, price rejected off the recent low |
| Structure | Buyers defended the swing low after the breakdown, recovery not yet confirmed |
| Liquidations | Longs dominate the 12h and 24h totals; shorts took the recent hourly hit |
| RSI | Trending lower, no fresh bullish confirmation yet |
| BTC Correlation | Bitcoin's weakness weighed on BCH's breakout attempt |
For context on how this kind of failed breakout has played out before, our BCH breakout or rejection breakdown covers a comparable setup.
Bitcoin Cash Support And Resistance Levels To Watch
| Type | Level | Note |
| Resistance 3 | $278.5 | Extended upside target |
| Resistance 2 | $255.2 | The next hurdle after $246.1 |
| Resistance 1 | $246.1 | First target on a confirmed close above $226.8 |
| Current Price | $211.50 | Sitting just above the immediate support zone |
| Support 1 | $209.4 | Immediate support zone |
| Support 2 | $200.60 | Deeper support, key closing-basis level |
| Support 3 | $181 | Next level on a confirmed close below $200.60 |
Risk-Reward Table
| Case | Trigger | Target |
| Bull Case | Breaks and closes above $226.8 | Move toward $246.1, then $255.2, $278.5 |
| Bear Case | Fails to hold and closes below $200.6 | Slide toward $181 |
Invalidation Level
The bullish read on $BCH stays intact as long as the price holds above $209.4 on a closing basis.
A confirmed close below that level shifts focus to $200.6, and a further close below $200.6 would open the door to $181.
If the price instead closes back above $226.80, that is treated as confirmation the recent breakdown has failed and buyers are back in charge.
This mirrors the closing-basis logic used in our BCH support breaks coverage, where a similar trigger determined the next move.
Historical Context
The rejection off the swing low is the more important detail here, since it shows buyers had enough strength to stop the breakdown from extending further, even after the trendline gave way.
Whether that turns into a full recovery back toward $226.80 and beyond, or just a pause before another leg down, should become clearer over the next few sessions.
A related setup played out in our BCH price prediction today piece, where the price also had to prove itself at a defended level before the next move became clear.
How Bitcoin Could Influence $BCH
While this setup is based on BCH's own 4-hour chart, Bitcoin remains the bigger swing factor here, and yesterday's Bitcoin weakness is a big part of why BCH's breakout did not hold.
If Bitcoin stabilizes or pushes higher, it improves the odds of BCH reclaiming $226.8 and working toward $246.1 and beyond.
A further Bitcoin slide, on the other hand, raises the chances of BCH testing $200.6 or even $181, regardless of the current rejection off the low.
Traders should also keep an eye on Bitcoin dominance, since a pullback there tends to help altcoins like BCH find fresh buying interest.
Bitcoin Cash Glossary
Descending Trendline: A falling line connecting a series of lower highs, used to track the pace and structure of a downtrend.
Swing Low: A short-term low point on the chart, often used as a reference for whether buyers are defending a level.
RSI (Relative Strength Index): A momentum indicator used to judge whether an asset has moved too far too fast in one direction.
Liquidation: What happens when a leveraged trade gets forcibly closed because the trader ran out of margin to keep it open.
BTC Dominance: Bitcoin's share of the total crypto market cap, often used as a gauge of whether capital is favoring Bitcoin or altcoins.
CoinGabbar's Technical Analyst View
The rejection of the recent swing low is the more meaningful signal on this $BCH chart since the price could have easily extended the breakdown after the trendline broke, and instead it closed back above the low.
That said, the failed breakout and Bitcoin's own weakness mean this recovery attempt is not confirmed yet. A close above $226.8 would support a move toward $246.1 and possibly $255.2.
A slip back below $200.60 on a closing basis would suggest sellers still have the upper hand, with $181.00 becoming the next level to watch.
Bitcoin's own direction, and whether its dominance eases, will likely have as much say in BCH's next move as this chart structure does.
Disclaimer: This article is for informational purposes only and should not be considered financial advice. Cryptocurrency markets are highly volatile, and price predictions are not guaranteed. Please do your own research before making any investment decisions.
Also read:

















