Bless Price Prediction: $BLESS Defends 0.618 Fib, Bullish Rally Ahead?


Bless is a crypto token that has been drawing attention for its sharp recent price swings and active trading community.
This Bless Price Prediction looks at where BLESS could head over the next one to two weeks after a pullback from a key resistance zone, with the bullish case staying intact as long as price holds above $0.016698, while a slip under that level would put the recovery in question.
Here's what the data shows.
Market data checked on August 8, 2026, at 11:56 IST.
BLESS Price Prediction Today: Market Overview
| Metric | Value |
| Price | $0.019336 |
| 24h Change | +25% |
| Market Cap | $31.591M |
| FDV | $171.532M |
| 24h Volume | $27.014M |
| Circulating Supply | 1.842B BLESS |
| Total Supply | 10B $BLESS |
| Max Supply | 10B $BLESS |
Source: Data from CoinGecko as of 08/08/2026 at 11:56 IST. Figures may vary slightly across other tracking websites.
BLESS Liquidation and Volume Data
BLESS token forecast: Long/Short Ratios (Coinglass)
Positioning on Binance currently leans long across the board.
The overall account ratio sits at 1.576, meaning there are notably more long accounts than short ones, while top traders are also net long but less aggressively, with an accounts ratio of 1.4248 and a positions ratio of 1.3513.
| Metric | Ratio |
| Binance BLESS/USDT Long/Short (Accounts) | 1.576 |
| Binance Top Trader Long/Short (Accounts) | 1.4248 |
| Binance Top Trader Long/Short (Positions) | 1.3513 |
BLESS token forecast: Futures Liquidations (Coinglass)
Liquidations have hit both sides of the market over the past 24 hours as price whipsawed sharply. 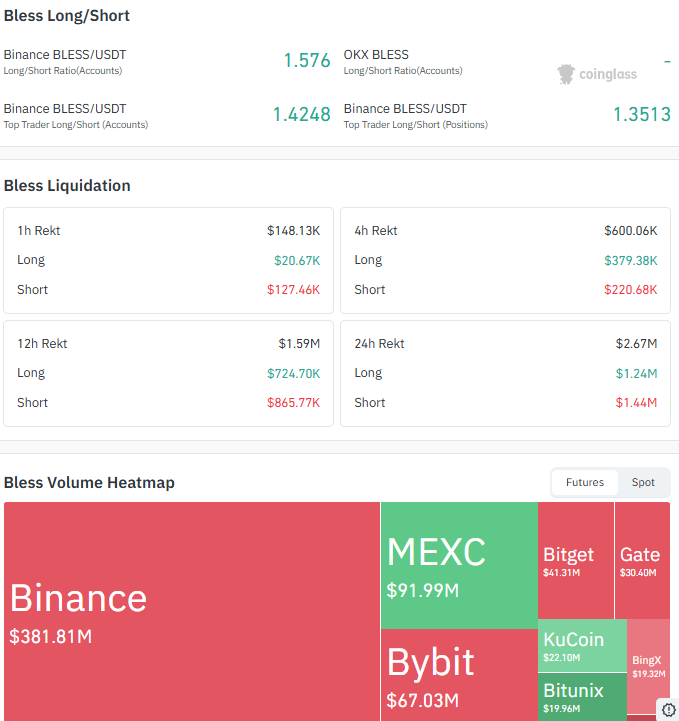
Source: Data From CoinGlass
The 1h window saw mostly short liquidations, while the 4h window flipped toward longs, and the 12h and 24h windows show a fairly even split between the two, reflecting the volatility of the recent move.
| Window | Long Liquidations | Short Liquidations |
| 1h | $20.67K | $127.46K |
| 4h | $379.38K | $220.68K |
| 12h | $724.70K | $865.77K |
| 24h | $1.24M | $1.44M |
BLESS token forecast: Futures Exchange Volume Breakdown
Binance leads $BLESS futures trading by a wide margin at $381.81M, followed by MEXC at $91.99M and Bybit at $67.03M. Bitget, Gate, KuCoin, Bitunix, and BingX make up the rest of the activity in smaller amounts.
| Exchange | Volume |
| Binance | $381.81M |
| MEXC | $91.99M |
| Bybit | $67.03M |
| Bitget | $41.31M |
Note: This is futures liquidation and volume data from Coinglass, kept separate from the CoinGecko spot volume figure in the Market Overview table above.
BLESS Price Prediction Chart: Technical Analysis
Pair: $BLESS/USD · Market: Spot (Crypto) · Timeframe: 1H · Source: TradingView · Timestamp: August 8, 2026, 11:56 UTC+5:30
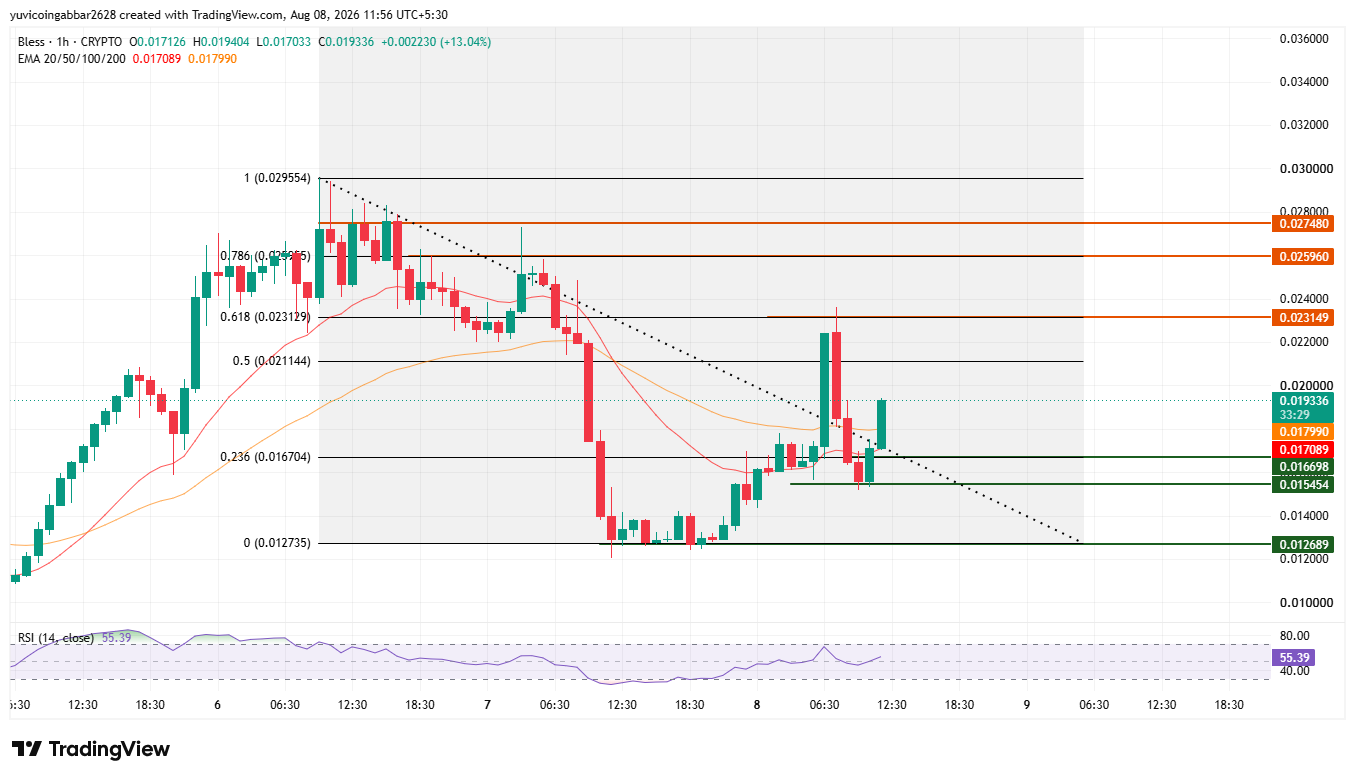
$BLESS rallied sharply toward the 1 Fibonacci retracement level at $0.029554 before correcting hard and falling back near the 0 level at $0.012735.
On the recent recovery leg, the price pushed up to test the 0.618 Fibonacci retracement zone near $0.023129, got rejected there, and pulled back toward the EMA cluster.
From that pullback, BLESS has since rebounded again at the 0.236 Fibonacci level, with the latest candle closing up. A sustained move above the 0.5–0.618 zone, roughly $0.021144 to $0.023129, would be needed to confirm a genuine bullish reversal.
Until that happens, the structure remains a recovery attempt within a broader corrective phase, not a confirmed trend change.
RSI sits at 55.39, a neutral-to-bullish reading with plenty of room before overbought territory.
The EMA cluster sits below the current price, with EMA 20 at $0.017089 and EMA 50 at $0.017990, both acting as support beneath the recent bounce.
Support and Resistance Levels
| Level Type | Price |
| Resistance 3 | $0.027480 |
| Resistance 2 | $0.025960 |
| Resistance 1 (nearest) | $0.023149 |
| Immediate Price Reference | $0.019336 |
| First Support | $0.016698 |
| Deeper Support | $0.015454 |
| Structural Floor | $0.012689 |
EMA Levels
| EMA | Price |
| EMA 20 | $0.017089 |
| EMA 50 | $0.017990 |
$BLESS Forecast: Bull Case vs. Bear Case
$BLESS price target 2026 Bull case: If the price sustains at the current level and breaks the upper resistance, the upper levels to watch are $0.023149 and $0.025960.
$BLESS price target 2026 Bear case: If it breaks below the $0.016698 support instead, the price can move toward the lower levels at $0.015454 and $0.012689.
$BLESS price target: Can BLESS Reach $0.027480?
$0.027480 is the highest resistance level marked on the chart. Reaching it would require $BLESS to first clear the nearest resistance at $0.023149, the level where the recent rally was already rejected once, and then hold above $0.025960.
a multi-stage move rather than a single leg.
What Could Invalidate the Bullish Setup?
A rejection at the nearest resistance near $0.023149 followed by a close back below the EMA cluster at $0.017089 to $0.017990 would put the recovery in question.
A deeper break below $0.016698 and the structural floor at $0.012689 would undermine the uptrend structure entirely.
$BLESS Price Prediction 2026: Expert View
According to CoinGabbar analysts , the pullback from the 0.618 Fibonacci level and the subsequent bounce suggest buyers are still active after the sharp correction from the recent highs.
Long/short positioning on Binance leaning toward 1.576 shows the market is currently biased long, though the fairly even liquidation split over the past 24 hours shows neither side has been in full control.
RSI at 55.39 leaves room for further upside without flagging overbought conditions yet.
The $0.016698 to $0.023149 zone is the key range to watch; holding above it keeps the recovery thesis alive, while losing it would suggest the pullback has more room to run.
BLESS Price Prediction: Data Sources
Price, EMA, RSI, and Fibonacci data referenced from a 1H $BLESS/USD chart via TradingView, timestamped August 8, 2026, 11:56 UTC+5:30.
Market cap, FDV, volume, and supply data referenced from CoinMarketCap.
Long/short ratio, liquidation, and futures exchange volume data referenced from Coinglass.
Disclaimer: This piece is for informational purposes only and isn't financial advice. The levels and scenarios above are based on technical chart analysis and publicly available data at the time of writing, and crypto markets can move sharply within hours, so past patterns don't guarantee future outcomes. It's worth doing independent research and considering your own risk tolerance before acting on any of the levels discussed here.
















