$BDAG Trying to Kill the Buyers: BlockDAG Global Launch in Few Hours!


Is BDAG's Chart Actually Trying to Trap Buyers Right Now?
BlockDAG Global Launch is back under pressure after BDAG dropped 17.67% today to $0.00003356, while the latest-chart reveals a technical structure that's becoming increasingly difficult for buyers.
Recent candles show large, sharp-bodied moves in both directions, with price now sitting just above a wide gap before the next major support level.
That setup, rather than sentiment alone, explains the "trying to kill the buyers" narrative and highlights a genuine structural risk visible on the chart.
This piece separates the promotional tweet from the technical picture and then builds full BlockDAG price prediction tables.
Live BDAG Data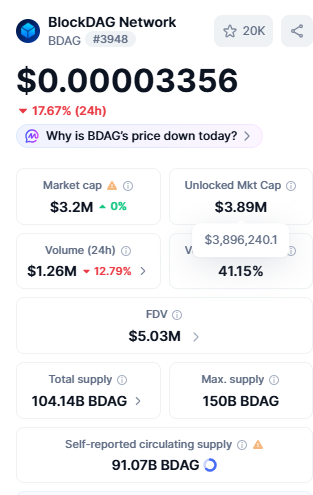
Source: Live BDAG dashboard, captured August 12, 2026
Metric | Value |
Current Price | $0.00003356, down 17.67% (24H) |
Market Cap | $3.2M (unchanged, 0%) |
Unlocked Market Cap | $3.89M |
24H Volume | $1.26M, down 12.79% |
Vol/Mkt Cap (24H) | 41.15% |
FDV | $5.03M |
Total Supply | 104.14B BDAG |
Max Supply | 150B BDAG |
Self-Reported Circulating Supply | 91.07B BDAG |
What the Official Tweet Claims
BlockDAG's post states all BDAG sales end tomorrow at 5:00 PM UTC, with a promotional buy price of $0.00000003, a live Keynote 6 teaser, and "Global Launch: NEXT" as the following milestone.
Source: posted on X by @blockdagnetwork
The post frames this as the final allocation buyers carry into Global Launch before sales close permanently: "Sales end tomorrow.
The global story starts next. "No explicit ROI multiplier is stated in this post.
For reference, dividing the current price ($0.00003356) by the cited $0.00000003 figure gives approximately 1,119x, which is worth noting even without an attached ROI claim this time.
DSNT Chart & Technical Analysis
This section covers the CoinMarketCap chart independently of the promotional claims above.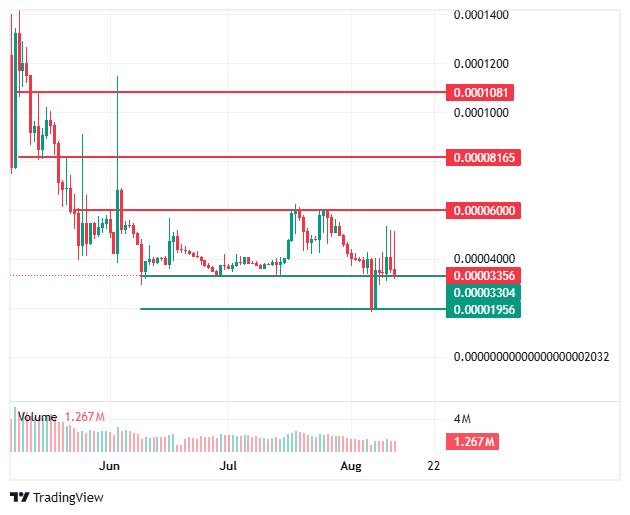
Source: BDAG Trading Chart by CoinMarketCap
Every Level Marked on the Chart
Level Type | Price |
Resistance 3 (outermost, upside) | $0.0001081 |
Resistance 2 (upside) | $0.00008165 |
Resistance 1 (nearest, upside) | $0.00006000 |
Pivot Line 1 (near current price) | $0.00003356 |
Pivot Line 2 (just below) | $0.00003304 |
Support (only level below, downside) | $0.00001956 |
Why This Chart Structure Looks Like a Trap Setup
The price currently sits within a tight $0.00003304-$0.00003356 pivot zone, but the next support level below it, $0.00001956, sits roughly 42% lower with no intermediate level marked between them. That is a wide, empty zone.
If today's large red candle continues and this tight pivot fails, there's no cushioning level to slow a drop before $0.00001956, meaning buyers who enter here without recognizing that gap could face a fast, uninterrupted decline if the pivot breaks.
Downside Path: What the View Confirms
If price moves lower from here, per the chart, the only remaining marked support is $0.00001956.
A confirmed break below the current pivot zone ($0.00003304-$0.00003356) opens a direct path toward that level, and because it's the last support shown on the chart, a break below $0.00001956 itself would put BDAG into territory with no further marked reference point, consistent with new all-time-low risk.
Upside Path: All Resistance Levels in Sequence
If price instead reverses higher, resistance applies in this order: $0.00006000 first (nearest), then $0.00008165, then $0.00010810 as the outermost and final marked level.
Today's 41.15% Vol/Mkt Cap ratio shows meaningful trading activity is present despite the 12.79% volume decline, but a large red candle day like today makes a near-term reversal through even the first resistance a higher bar to clear.
BlockDAG Price Prediction: Pre-Sales-Close Scenario
Scenario | Estimated Price Range | Key Drivers |
Bear Case | $0.000024-$0.000031 | Pivot zone breaks, large red candles continue, and a gap toward $0.00001956 opens up |
Base Case | $0.000032-$0.000038 | Price holds within or near the current pivot zone through the sales-close deadline |
Bull Case | $0.000045-$0.000058 | Buying interest returns ahead of the deadline, first resistance ($0.00006000) comes into range |
BlockDAG Price Prediction: Post-Global-Launch Scenario
Scenario | Estimated Price Range | Key Drivers |
Bear Case | $0.000015-$0.000024 | Confirmed break below $0.00001956, weak initial Global Launch trading liquidity |
Base Case | $0.00005-$0.00007 | Price stabilizes above the pivot zone; Global Launch executes with steady volume |
Bull Case | $0.00009-$0.00012 | Confirmed breakout through all three resistance levels, sustained post-launch demand |
Methodology Note: Both BDAG price prediction tables above are built from current chart levels and today's volume data, not the promotional $0.00000003 sales-closing price, which is a historical entry reference, not a technical chart level.
Risks Worth Naming
The clearest structural risk is the wide, unmarked gap between the current pivot zone and the only remaining support at $0.00001956; a confirmed breakdown here has no cushioning level before that point.
Second, today's 17.67% single-day decline on large candles is consistent with the "trap" framing; sharp moves like this can catch buyers entering without checking the broader chart structure.
Third, the sales-close deadline (tomorrow, 5 PM UTC) is a promotional urgency mechanism and should not be treated as a technical signal on its own.
Fourth, self-reported circulating supply (91.07B of 150B max) remains project-disclosed, not independently audited.
Glossary
Pivot Zone: A tight price range acting as a decision point between the nearest support and resistance, where a breakout or breakdown becomes more likely than continued consolidation.
Vol/Mkt Cap Ratio: Daily trading volume divided by market cap, indicating how actively a token trades relative to its size.
Disclaimer
Informational purposes only, not financial advice. BlockDAG price prediction ranges above, across both tables, are analyst estimates based on current chart levels and volume data, not guarantees. Self-reported supply figures are project-disclosed, not independently audited. The promotional sales-close deadline is time-limited marketing language, not a technical indicator. Cryptocurrency carries significant risk of loss.
Also read:

















