PAX Gold Price Prediction: $PAXG DeFi Demand Rises, Buy Opportunity?


PAXG is breaking higher just as gold-backed DeFi gets a fresh boost, and traders are asking if this is the moment to pay attention.
A new lending market now lets holders borrow and lend against their gold-backed tokens, adding real utility on top of price strength.
This PAX Gold Price Prediction looks at whether the current breakout can keep pushing higher over the next one to two weeks, with the setup staying strong as long as price holds above $4,319.01.
Momentum is building fast, and the next resistance test could decide how far this run goes.
Market data was checked on August 12, 2026, at 15:17 IST.
PAX Gold Price Prediction Today: Market Overview
Metric | Value |
Price | $4,407.53 |
24h Change | +0.89% |
Market Cap | $1.92B |
FDV | $1.92B |
24h Volume | $183.1M |
Vol/Mkt Cap (24h) | 9.51% |
Liquidity/Mkt Cap | 1.01% |
Total Supply | 436.55K $PAXG |
Max Supply | No max supply |
Circulating Supply | 436.55K $PAXG |
Holders | 85.89K |
Source: Data from CoinMarketCap as of August 12, 2026, at 15:17 IST. Figures may vary slightly across other tracking websites.
PAXG Gold-Backed DeFi: What Kamino Announced
Kamino, an official DeFi protocol on Solana, announced 24/7 credit markets for tokenized gold. 
Source: Data From X
The update lets PAXG holders access $USDG liquidity against their PAXG in a fully isolated market, unlocking the ability to borrow, lend, and leverage gold-backed credit.
Since this comes directly from Kamino's official account, it's treated as confirmed news rather than an unverified claim.
This kind of DeFi (decentralized finance, meaning financial services like lending and borrowing that run on blockchain instead of banks) utility adds a real use case for PAXG beyond simply holding it as a gold proxy.
PAX Gold Price Prediction Chart: Technical Analysis
Pair: PAX Gold/USD · Market: Spot (Crypto) · Timeframe: 1D · Source: TradingView · Timestamp: August 12, 2026, 15:17 UTC+5:30
$PAXG is trading at $4,407.53, after breaking out of the base it had built through June and July.
Price has already cleared both the EMA 20 at $4,218.14 and EMA 50 at $4,181.14, and is now pushing into the resistance area following the breakout.
RSI (14) reads 69.99, showing strong bullish momentum and sitting right at the edge of overbought, which lines up with the sharp move higher over the past several sessions.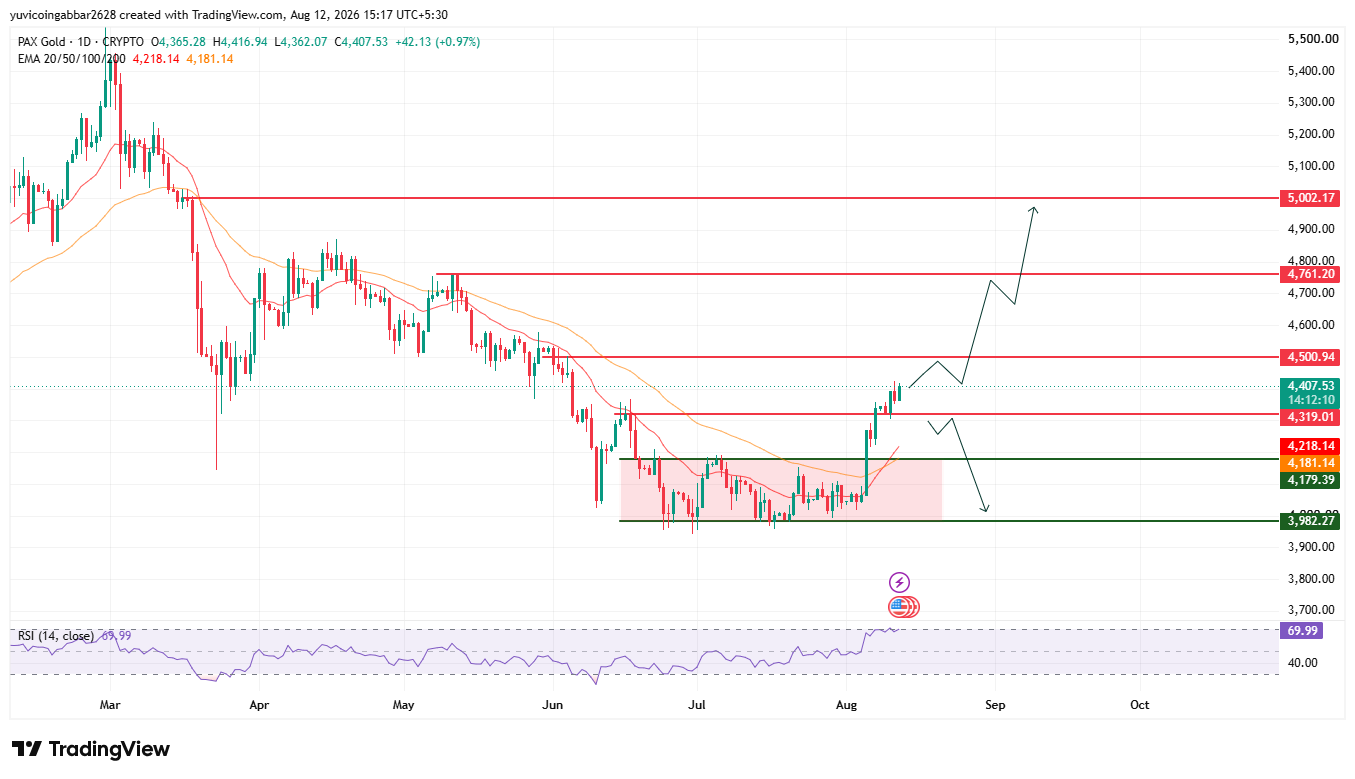
Support and Resistance Levels
Level Type | Price |
Resistance 3 | $5,002.17 |
Resistance 2 | $4,761.20 |
Resistance 1 (nearest) | $4,500.94 |
Immediate Price Reference | $4,407.53 |
Support 1 | $4,319.01 |
Support 2 | $4,179.39 |
Deeper Support | $3,982.27 |
EMA Levels
EMA | Price |
EMA 20 | $4,218.14 |
EMA 50 | $4,181.14 |
PAX Gold Forecast
$PAXG price target 2026 Bull Case: If the price holds above Support 1 at $4,319.01 and clears the nearest resistance at $4,500.94, we could see continuation toward $4,761.20 and eventually $5,002.17.
Growing DeFi utility from markets like Kamino could add extra demand behind that move if it plays out.
$PAXG price target 2026 Bear Case: If the price breaks below Support 1 at $4,319.01, it could slip back toward Support 2 at $4,179.39, right around the EMA cluster.
Losing that zone would expose the deeper support at $3,982.27 and put the current breakout in real doubt.
$PAXG Price Target: Can PAXG Reach $5,002.17?
$5,002.17 is the highest resistance level marked on the chart.
Reaching it would require $PAXG to first clear the nearest resistance at $4,500.94, then break and hold above $4,761.20, a multi-stage move that would need sustained buying pressure rather than a single push.
What Could Invalidate the Bullish Setup?
A rejection at $4,500.94 followed by a close back below Support 1 at $4,319.01 would put the breakout in question.
A deeper break below Support 2 at $4,179.39 and the EMA cluster would suggest the recent move higher is fading rather than continuing.
PAX Gold Price Prediction: Expert View
According to CoinGabbar analysts, PAXG's breakout above its EMA cluster, combined with RSI near overbought at 69.99, points to strong short-term buying pressure.
The new Kamino lending market adds a genuine utility angle on top of that price strength, giving holders a reason to keep PAXG rather than sell into the rally.
The $4,319.01 to $4,500.94 range looks like the key near-term battleground: holding it keeps the breakout thesis intact, while losing it would suggest the move is running out of steam.
Disclaimer: This piece is for informational purposes only and isn't financial advice. The levels and scenarios above are based on technical chart analysis and publicly available data at the time of writing, and crypto markets can move sharply within hours, so past patterns don't guarantee future outcomes. It's worth doing independent research and considering your own risk tolerance before acting on any of the levels discussed here.
Also read:

















