BlockDAG Price Prediction: Rounding Bottom, Rises 23%, Recovery Hold?


$BDAG is moving higher again this week as traders look for a potential change in direction after months of grinding lower.
This Blockdag Price Prediction looks at whether this fresh push higher has real legs and what it would take to turn this into an actual recovery.
BlockDAG describes itself as a network combining blockchain and DAG architecture. Keep reading to see where this move could realistically go from here.
BDAG Price Today: Market Overview
Metric | Value |
Price (BDAG/USD) | $0.00005823 |
24h Change | +23.15% |
Market Cap | $47.67M (+0%) |
Unlocked Market Cap | $6.67M |
Fully Diluted Valuation | $153.71M |
24h Trading Volume | $2.12M (+17.42%) |
Volume / Market Cap (24h) | 39.01% |
Circulating Supply | 91,332,891,909 BDAG |
Total Supply | 103,860,611,280 $BDAG |
Max Supply | 150,000,000,000 $BDAG |
Source: Data from CoinMarketCap as of July 25, 2026. Figures may vary slightly across other tracking websites.
BDAG Forecast 2026: Chart Analysis
BDAG's hourly chart shows a rounding bottom pattern, where price gradually curved from a steady decline into a flattening base and then into the current upward push, rather than the sharp, V-shaped reversal seen in some other setups.
The EMA 9 at $0.00005212 has crossed above the EMA 20 at $0.00004966, a short-term bullish signal, and the current price at $0.00005823 is trading above both averages, meaning the immediate trend has turned upward.
Price now needs to clear the $0.00006018 level to confirm the breakout is extending rather than fading. Above that, the next real test is $0.00006885, and further out, $0.00009757 marks the top of the visible resistance structure on this chart.
On the downside, the EMA 9/20 cluster between $0.00004966 and $0.00005212 is now the first line of dynamic support, with a deeper support zone at $0.00004528 and a liquidity area at $0.00003336 if the rounding bottom fails to hold.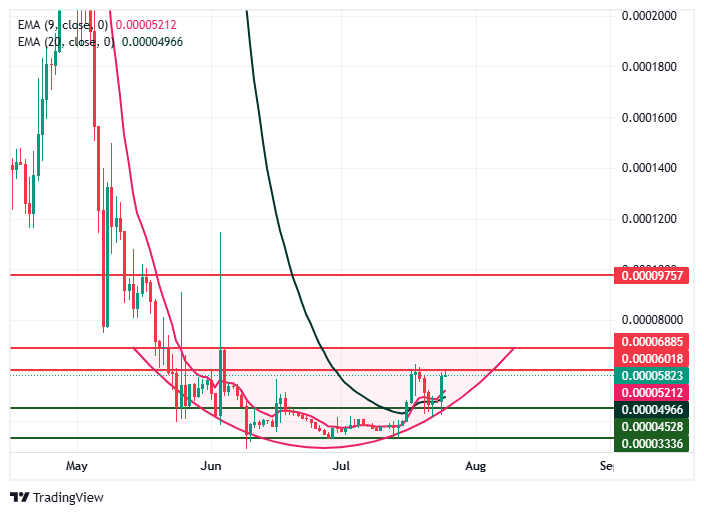
Level | Price | Type |
Far resistance | $0.00009757 | Upper structure, not near-term relevant |
Upper resistance | $0.00006885 | Secondary target above the immediate breakout zone |
Immediate resistance | $0.00006018 | First level to clear to confirm continuation |
Current price | $0.00005823 | Trading above the EMA cluster |
EMA 9 (dynamic support) | $0.00005212 | Short-term moving average, now below price |
EMA 20 (dynamic support) | $0.00004966 | Longer moving average, crossed by EMA 9 |
Support | $0.00004528 | First support zone below the EMA cluster |
Liquidity area | $0.00003336 | Deeper support if the rounding bottom fails |
BDAG Price Prediction: Price Scenarios
Scenario | Target | Probability | Trigger | Timeframe |
Bullish | $0.00006885 | 30% | Clean break and hold above $0.00006018 on continued volume | 3 to 7 days |
Base Case | $0.00005212 to $0.00006018 | 50% | Price consolidates around the EMA cluster without a decisive break either way | 3 to 7 days |
Bearish | $0.00004528 | 20% | Loss of the EMA 9/20 cluster, rounding bottom pattern fails | 3 to 7 days |
Probability weighting reflects that the rounding bottom and EMA crossover are still fresh and unconfirmed, favoring consolidation over an immediate breakout or breakdown.
Two Scenarios to Watch
Bounce Scenario: If BDAG holds above the $EMA 9/20 cluster and clears $0.00006018 on rising volume, the path opens toward $0.00006885, and eventually the $0.00009757 zone is further out.
This scenario is invalidated by a close back below the $EMA 20 at $0.00004966.
Breakdown Scenario: If price fails to hold the $EMA cluster and slips back below $0.00004966, the rounding bottom pattern would be undermined, opening a slide toward the $0.00004528 support and potentially the $0.00003336 liquidity zone.
This scenario is invalidated by a reclaim of the $EMA cluster on rising volume.
Risk Note
BDAG remains down 99.99% from its all-time high of $0.4005, and the current move, while sharp, has only recovered a small fraction of that drawdown.
A single day of 23% gains on a token this far below its peak can reverse just as quickly if volume fades.
Trading volume equal to 70.26% of market cap points to elevated short-term speculation around this move, which can cut both ways.
Treat the rounding bottom as a pattern still in progress rather than a confirmed reversal until the price clears the immediate resistance on sustained volume.
BDAG Market Outlook: Expert View
According to CoinGabbar analyst, the $EMA crossover and rounding bottom structure give this bounce more technical credibility than a simple oversold spike, but the token remains deep in drawdown territory, and the move has not yet been tested against real resistance.
Whether BDAG can build on this recovery will likely come down to whether buyers can push and hold price above the $0.00006018 level in the coming days, rather than the size of the initial 23% move itself.
Data Sources: Price, market cap, and supply data as provided and checked July 25, 2026. Technical levels based on the hourly chart with EMA 9 and EMA 20 indicators, as provided.
Disclaimer This article is for informational purposes only and should not be considered financial or investment advice. Cryptocurrency markets are highly volatile, and prices can change rapidly based on market conditions. Readers should conduct their own research and consult a qualified financial advisor before making any investment decisions. CoinGabbar does not guarantee the accuracy of price predictions, and past performance is not indicative of future results.
Also read:

















