BNB Price Forecast August 2026: $BNB Targets, Levels, Risks


A Chart That's Gone Quiet Right Before a Loud Quarter
Here's a question worth sitting with: why does a coin that just burned $1B worth of its own supply and landed a Nasdaq ETF still look this calm on the chart? Traders chasing headlines expected a bigger reaction. They didn't get one, not yet.
That gap between the news and the candles is exactly why this BNB price forecast August 2026 matters. Something is building underneath the surface, even if price hasn't caught up. This BNB August 2026 scenario forecast breaks down how each path could unfold.
So what happens next, and is now the moment to act or wait?
$BNB Price Today: Live Data Behind This $BNB Forecast August 2026
Live data and coin overview, per CoinMarketCap, as of 10:00 UTC on July 30, 2026:
| Metric | Value |
|---|---|
| Price | $577.81 |
| 24H Change | +1.14% |
| Market Cap | $76.94B (+1.15%) |
| 24H Volume | $1B (+2.28%) |
| Volume/Market Cap | 1.3% |
| 24H Range | $565.08 – $578.05 |
| Circulating Supply | 133.16M BNB |
| Total Supply | 133.16M BNB |
| Treasury Holdings | 686.07K BNB |
| All-Time High | $1,370.55 (Oct 13, 2025) |
| All-Time Low | $0.09611 (Aug 1, 2017) |
| Native Chain | BNB Smart Chain (BEP-20) |
| CertiK Rating | 4.8 / 5 |
This $BNB price prediction August 2026 starts from a simple base: short-term momentum is mildly positive, not explosive. Circulating, total, and max supply all sit at 133.16M BNB, so there's no future dilution risk, only supply shrinking further through burns. You can track how that plays out day to day on the BNB price prediction today page.
Will $BNB Go Up in August 2026? Technical Analysis
Both the daily and weekly charts, viewable live on the BNB/USDT TradingView chart, show the same descending channel that's capped $BNB since last October, and that agreement matters more than either reading alone. When a shorter timeframe and a longer one point in the same direction, it usually means the pattern has broader support than a single-session move rather than being an artifact of one noisy candle.
Daily Chart: BNB Price Forecast August 2026
On the daily timeframe, $BNB is consolidating in the middle of a tightening range. Daily RSI, a momentum gauge that reads from 0 to 100, sits at 53.85, which is neutral. It's not pointing toward an imminent breakout or breakdown; it's just sitting in the zone where price could go either way depending on what triggers it next.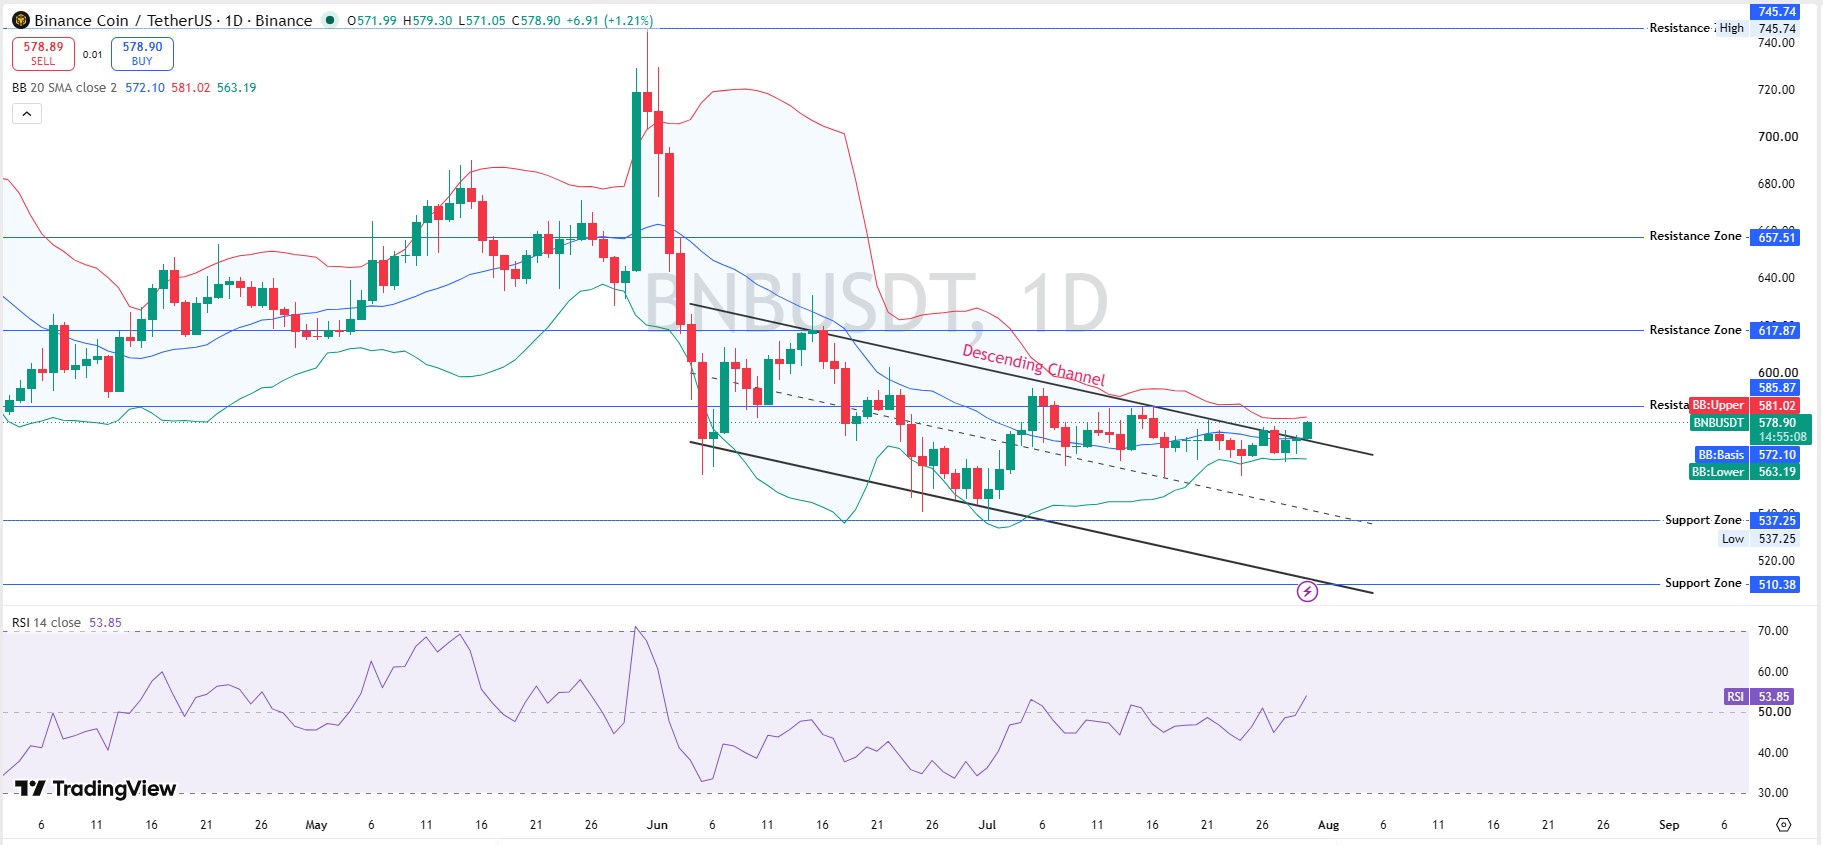
Daily Bollinger Bands, which measure how far price has stretched from its own short-term average, show a basis (the 20-day average) of $572.10, an upper band of $581.02, and a lower band of $563.19. $BNB is trading almost exactly between those bands right now. That's a sign of low short-term volatility, the kind of quiet that often comes right before a bigger move, in either direction.
The daily descending channel, the pair of trendlines that have contained price since last October, still caps upside near the top of that structure. A daily close above $581.02 would be the first real sign this channel is breaking, a similar setup to the one shaping the Ethereum price prediction 2026 outlook, where a major coin is stuck under a long trendline too. Until then, $BNB is doing what it's done for weeks: drifting inside a shrinking box.
Weekly Chart: $BNB Price Forecast August 2026
The weekly timeframe tells a slightly more cautious story. Weekly RSI reads 41.06, soft, and closer to oversold territory than the daily reading, though not there yet. That gap between daily (neutral) and weekly (soft) matters: it suggests the bigger-picture trend is still working through a longer digestion phase, even while the shorter-term chart looks calm.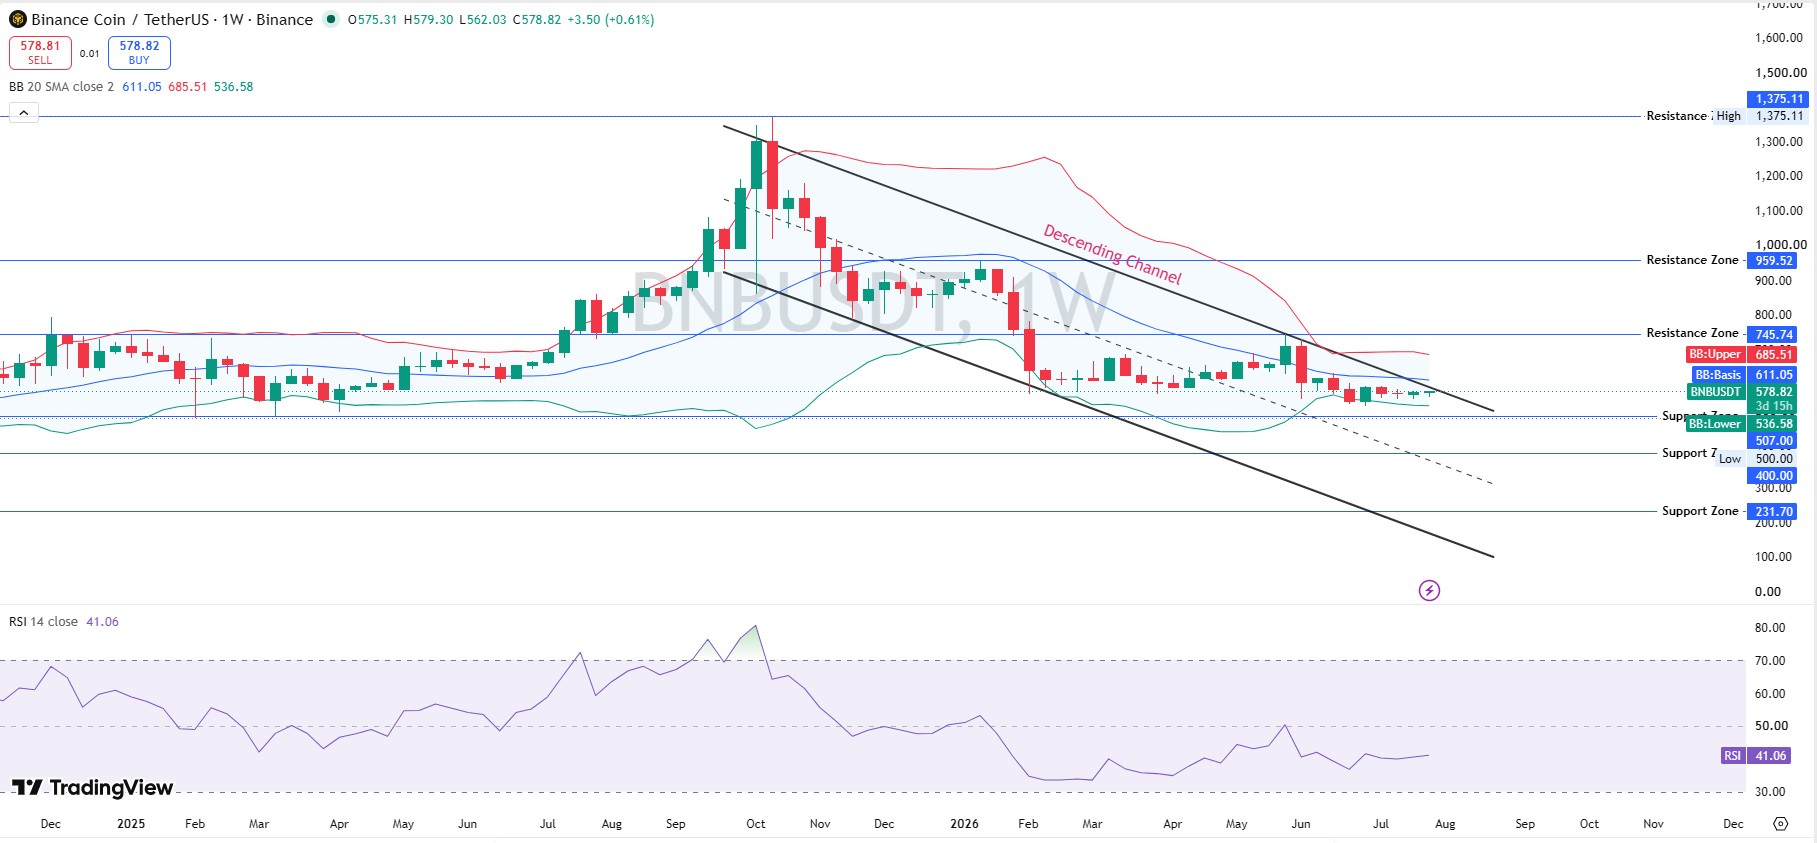
Weekly Bollinger Bands run from a $536.58 lower band to a $685.51 upper band, with a $611.05 basis. $BNB currently trades below its own weekly average, meaning the broader trend has more ground to recover before it's back to "normal" by its own recent standards.
The weekly descending channel is the same structural ceiling driving the 2026 outlook further down in this forecast. As long as $BNB stays under that channel's upper trendline, rallies are more likely to get sold into than to run freely.
Key Levels: $BNB Support and Resistance for August 2026
Putting both timeframes together, $BNB resistance levels for August 2026 stack at $617.87, then $657.51, then a heavier wall near $745.74, each one drawn from where the price has previously stalled or reversed. BNB support levels sit at $537.25, then $510.38, both levels where buyers have stepped in before. These are the key levels to watch this month: a daily close above $581.02 opens the door toward the first resistance zone, while a daily close below $563.19 shifts the focus down toward support instead.
$BNB Price Prediction August 2026: Bull, Base, and Bear Cases
| Scenario | August 2026 Outlook | What Needs to Happen |
|---|---|---|
| Bull Case | BNB clears the descending channel and runs toward $657.51, with a stretch target near $745.74. | Daily close above the $581 upper band, holds $563 support, and ETF inflows pick up. |
| Base Case | Range-bound between $537 and $618, with a gradual upward bias. | Support holds, but breakout momentum remains limited. |
| Bear Case | Slips below $537.25, retests $510.38, or potentially the $400 zone. | Support fails, BTC weakens, or the ETF/burn narrative fades. |
Invalidation for the bullish $BNB price target of August 2026: a daily close under $563.19, the lower daily Bollinger Band. A close under $537.25 would confirm the deeper bear case, a level covered in more depth in the BNB $537 support level analysis. These are directional reads, not guarantees.
$BNB Chain Catalysts Behind This Forecast
$BNB Chain just closed a quarter where a $BNB ETF listed on Nasdaq, tokenized SpaceX equity started trading on-chain, and 1.57M BNB, worth roughly $1B, got burned in a single event. The Q2 2026 report from Blockworks Advisory cited $59B in onchain volume and 4.5M contracts deployed.
Recent $BNB Chain posts add more texture: SilentSwap brought private, non-custodial swaps to the network, Flap added tokenized stocks and gold as quote assets for meme tokens, and Unitas Labs' tokenized gold product passed $15M in TVL. Moves like these keep showing up in the latest crypto news as they land.
But the VanEck BNB ETF (VBNB), tracked live on SoSoValue, tells a quieter story so far. Daily net inflow sat at $0.00, cumulative net inflow reached $1.45M, and total net assets stand at $2.21M, just 0.00% of BNB's market cap. Early days, not a confirmed catalyst yet.
Liquidity and Derivatives Risk
Futures volume runs heavily through Binance, at $266.90M, ahead of OKX and Bybit. Over 24 hours, CoinGlass data shows $467.83K in positions got liquidated, with longs taking the bigger hit at $300.72K against $167.11K in shorts. The most recent hour flipped that, with shorts absorbing nearly the full $15.12K wiped out.
$BNB Long-Term Outlook: 2027 to 2030
Longer term, a $BNB price prediction 2026 and beyond stays conditional, much like the broader setup laid out in this Bitcoin price prediction 2026, since $BNB rarely moves far from BTC's own trend. A sustained channel breakout could open a path back toward the $960-$1,375 zone over 2027-2028, a scenario the BNB 2028 outlook maps out in more detail, but that needs real ETF flow, not just a burn headline. Can BNB reach $1,000 or higher? Possible over multiple years if adoption and burns compound, but not something this month's chart supports on its own.
Should You Buy BNB Now or Wait?
Whether $BNB is a good investment right now depends on risk tolerance and time horizon, since this setup mixes real network growth with an unproven ETF and a stalled chart. If you're weighing entry points, the crypto exchange listing tracker is a useful way to see where liquidity is building next. This is market analysis, not personal financial advice.
Risks That Could Change This BNB Forecast
Bitcoin weakness tops the list; $BNB rarely decouples for long. A slower-moving but real risk sits with BNB's ongoing FTX legal battle exposure, which has periodically weighed on sentiment.
Thin ETF inflows mean that catalyst hasn't proven itself. A $BNB Chain activity slowdown, or a failed channel breakout, would undercut the bullish case fastest. It's worth checking scheduled unlocks and announcements against the coin events calendar before treating any single month's setup as settled.
Methodology: Chart levels from BNB/USDT daily and weekly charts on Binance via TradingView, RSI-14, and 20-period Bollinger Bands, captured July 30, 2026. Market cap, supply, and ETF data from CoinMarketCap and SoSoValue. Liquidation and volume data from CoinGlass.
Disclaimer: This is speculative market commentary, not financial advice. Crypto assets are volatile. Verify live figures before trading.









.jpg)








