BNB Price Prediction: Can Binance Coin Rally to $961?


This BNB price prediction lands right after a structure that had capped price for months finally gave way.
A single oversized candle, backed by real volume, pushed BNB clean through a trendline that had held since February.
Follow-through candles kept the momentum going, and Binance coin is now sitting close to a level that could open the door to a much bigger move. Here is what the data shows.
This analysis is prepared by CoinGabbar's technical desk using live exchange data. It is for informational purposes only and is not financial advice, and CoinGabbar and the analyst do not hold a position in BNB at the time of publication.
The levels below come from a daily chart and reflect a short-term technical view, not a guaranteed outcome.
Binance Coin Price Right Now: Live Data and Key Levels
Metric | Value |
CMP (Current Market Price) | $673.95 |
24-Hour Change | +5.25% |
Market Cap | $89.63 billion |
Futures Volume (24h) | $1.56 billion |
Spot Volume (24h) | $282.77 million |
Open Interest | $1.07 billion |
Circulating Supply | 133.16 million BNB |
Total Supply | 133.16 million BNB |
Max Supply | 133.16 million BNB |
Futures volume of $1.56 billion against spot volume of $282.77 million works out to roughly 5.5 times more futures activity than spot, an independently calculated ratio showing leveraged traders are behind most of today's move.
Open interest of $1.07 billion against an $89.63 billion market cap puts leverage exposure at just 1.2% of market cap, a low reading that suggests plenty of room for more leveraged positioning if the breakout continues.
BNB's circulating, total, and max supply all sit at 133.16 million, so there is no future supply overhang to factor into this Binance coin price prediction.
Source: CoinGlass live market data, August 21, 2026. Chart source: TradingView, Binance Coin/USDT Perpetual, Binance, 1-day timeframe.
Methodology Behind This Binance Coin Price Prediction Today
This Binance coin price outlook is built on the daily BNB/USDT perpetual chart on Binance, viewed through TradingView.
CMP is taken from the live price marked on that chart, and target and support levels are pulled directly from old swing highs and lows marked on the same chart.
BNB Liquidation Data Today
Short-side liquidations have dominated every single window over the past 24 hours, from $689.16K in the last hour up to $5.23 million over the full 24-hour window.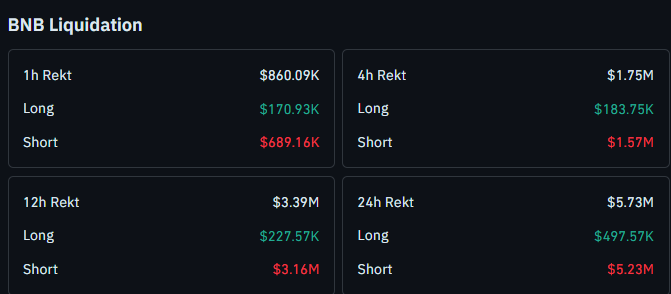
The 4-hour window shows $1.57 million short against $183.75K long, and the 12-hour window shows $3.16 million short against $227.57K long.
That is a consistent pattern rather than a one-off spike, and it lines up cleanly with the trendline breakout, with short sellers getting squeezed repeatedly as Binance coin pushed higher on strong volume.
Source: CoinGlass liquidation data, August 21, 2026.
BNB Trend and Momentum: Key Takeaways for Traders
Binance coin broke its daily descending trendline on a large candle backed by huge volume, with follow-through candles confirming the move
CMP is trading near $673.95, up 5.25% over the past 24 hours per CoinGlass
A close above $746.44 that sustains opens the door toward $823.30, then $878.93, then $961.44
A break and close below $652.21 would open the door toward $633.19 as the next support
Short-side liquidations have dominated every window over the past 24 hours
This is a short-term technical read. Even strong trendline breakouts can see sharp pullbacks, so these levels should not be treated as guaranteed outcomes.
Binance Coin Price Prediction: Daily Chart Breakout Analysis
Binance coin has broken its daily descending trendline on a large candle backed by real volume, and the candles since have kept pushing in the same direction, a sign this move has real conviction behind it.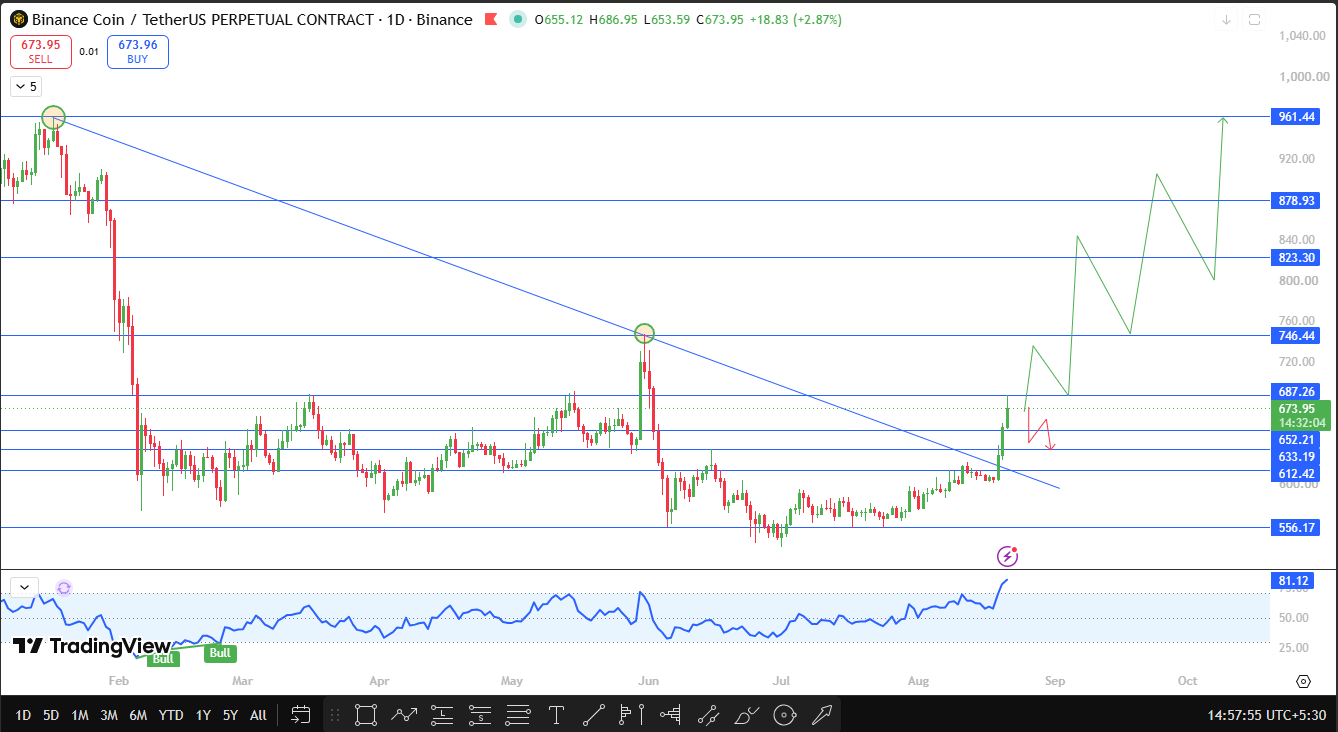
If the price breaks and closes above $746.44 and sustains that move, the next levels to watch are $823.30, $878.93, and $961.44, all marked off old swing highs on the chart.
On the downside, this Binance coin price prediction stays structurally bullish unless the price breaks and closes below $652.21.
A break like that would open the door toward $633.19 as the next support, an old marked swing low.
Technical Outlook Snapshot for This Binance Coin Price Prediction
Indicator | Signal |
Chart Pattern | Daily descending trendline, breakout on huge volume with follow-through candles |
Momentum Panel (TradingView, 1D) | 81.12, Bull tag active, overbought |
Near-Term Bias | Bullish above $652.21, confirmation needed above $746.44 |
BNB Support and Resistance Levels Worth Watching Now
Level Type | Price | % From CMP | Note |
Major Resistance 3 | $961.44 | +42.66% | Old swing high |
Major Resistance 2 | $878.93 | +30.42% | Old swing high |
Major Resistance 1 | $823.30 | +22.16% | Old swing high |
Resistance 0 (trigger) | $746.44 | +10.76% | Old swing high, breakout continuation trigger |
Current Price | $673.95 | 0% | Live CMP, Binance perpetual, 1D chart |
Support 1 (trigger) | $652.21 | -3.23% | Old swing low, breakdown trigger |
Support 2 | $633.19 | -6.05% | Next, old swing low. |
Support 3 | $612.42 | -9.13% | Extended chart-marked support |
BNB Risk-Reward Table for the Trendline Breakout Setup
Case | Trigger | Target |
Bull Case | Sustained close above $746.44 | $823.30, then $878.93, then $961.44 |
Bear Case | Sustained close below $652.21 | $633.19 |
Setup invalidation | Close back below $652.21. | Trendline breakout structure fails, bullish bias invalidated |
Invalidation Level for This BNB Price Forecast
This BNB price forecast stays bullish while Binance coin holds above $652.21. It would be invalidated by a break and close below that level, shifting focus toward $633.19.
How Bitcoin Sentiment Could Move This BNB Price Outlook
Binance coin, like most large-cap tokens, tends to take direction from the broader tone Bitcoin sets across the market.
Strength in Bitcoin could help BNB push through $746.44 faster, while sudden weakness on Bitcoin could pressure the price back toward $652.21.
This price prediction is based on BNB's own chart structure, but Bitcoin remains a factor worth watching alongside it.
Planned Update for This Binance Coin Price Prediction
This BNB price prediction will be revisited if price closes decisively above $746.44 or below $652.21, or if fresh liquidation data meaningfully shifts the current picture.
Glossary of Terms Used in This BNB Technical Analysis
CMP: Current Market Price, the live traded price at the time of analysis
Open Interest: The total value of outstanding, not yet settled derivative contracts for an asset
Liquidation: The forced closure of a leveraged trading position when losses exceed the margin held
Descending Trendline: A downward-sloping line connecting successive lower highs, acting as resistance until broken
CoinGabbar Technical Analyst View on BNB Price Action
Bull Case: A sustained close above $746.44 confirms the trendline breakout has real strength, opening a path toward $823.30, $878.93, and $961.44, supported by consistent short-side liquidations.
Base Case: BNB consolidates between $652.21 and $746.44 as the market digests the breakout after the recent volume-backed candle.
Bear Case: A close below $652.21 invalidates the breakout structure and opens room toward $633.19, particularly if the current short-covering pressure fades.
Disclaimer
This article is for informational purposes only and should not be treated as financial advice. Cryptocurrency markets are highly volatile, and readers should do their own research before making any investment decisions. CoinGabbar and the analyst do not hold a position at the time of publication.










.webp)






