BNB Price Prediction: Can Binance Coin Rally to $630?


BNB price prediction interest is climbing again as Binance Coin grinds higher along a trendline that has held firm through every dip so far.
The coin is sitting right in a zone that could decide the next leg, and traders are watching closely to see which way it tips.
Technical analysis prepared by CoinGabbar's crypto research desk. This piece is for informational purposes only and is not financial advice. CoinGabbar and the analyst do not hold a position in Binance coin at the time of publication.
The levels described here apply strictly to the 1-hour timeframe covered and should be rechecked if the price closes beyond the stated range.
Key Takeaways
Binance coin is holding an ascending trendline as support after climbing from recent lows
Price is trading just below the $596.64 zone, the first hurdle above current levels
A close above $596.64 opens the door to $602.78 and then $632.77
A pullback to the trendline or $581.62 that holds keeps the same targets intact
Shorts led liquidations over the past 24 hours; longs led the shorter 1h and 4h windows
BNB Price Right Now
Metric | Value |
Price | $590.28 |
24h Change | +1.29% (+$7.517) |
Market Cap | $78.52B |
Futures Volume (24h) | $490.75M |
Spot Volume (24h) | $66.87M |
Open Interest | $945.70M |
Circulating Supply | 133.16M $BNB |
Total Supply | 133.16M $BNB |
Max Supply | 133.16M $BNB |
Open interest is the total value of Binance coin derivative contracts still open across exchanges, a rough gauge of active leveraged positioning.
Chart source: BNB/USDT 1-hour perpetual contract, TradingView, Binance data feed, captured August 4, 12:49 PM IST (07:19 AM UTC). Market cap, volume, and supply data from BNB market data on CoinGlass were captured the same day.
Where This BNB Setup Fits the Bigger Picture
This read uses the BNB 1-hour chart for structure, with volume, open interest, and liquidation flow from CoinGlass.
For a wider view of how this ties into the month ahead, see BNB price targets forecast . Levels are only invalidated on a confirmed closing candle beyond the stated trigger, not an intraday wick.
Binance coin Enters the S&P Pantera Digital Asset Index
BNB Chain announced that BNB now ranks second among the 18 constituents of the new S&P Pantera digital asset index, built jointly with S&P Dow Jones Indices and Pantera Capital, with every asset screened on protocol revenue rather than just market value.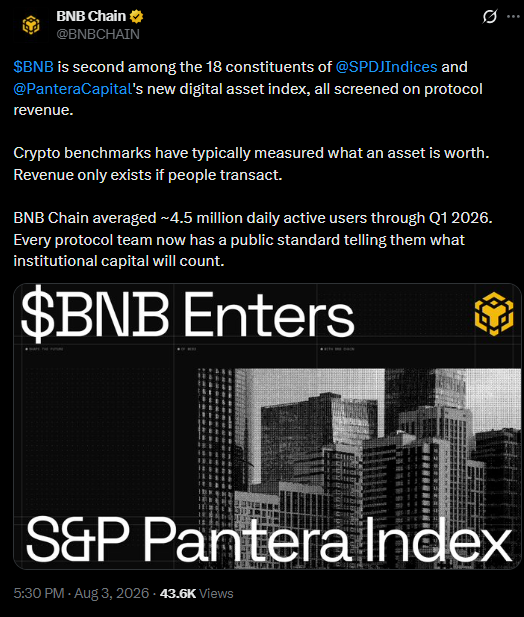
The chain also noted it averaged close to 4.5 million daily active users through the first quarter of the year, a figure now tied directly to how institutional capital screens the asset going forward.
This kind of index inclusion does not move price on its own, but it adds a fresh institutional angle worth tracking alongside the pure chart setup covered here.
Source: BNB Chain on X, August 3, 5:30 PM, 43.6K views at time of capture.
BNB Liquidation Snapshot Across Every Timeframe
Liquidation flow is mixed depending on the window. 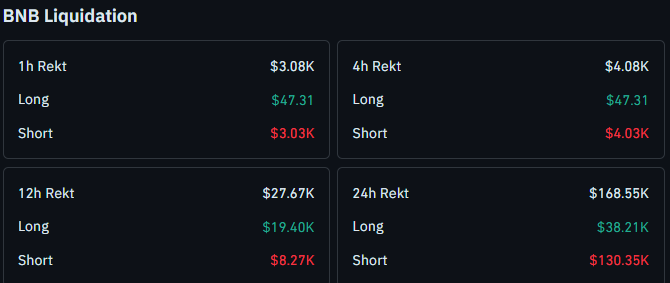
Over the past hour, $3.08K was liquidated, almost entirely from shorts at $3.03K against just $47.31 from longs.
The 4-hour window matches that lean, with $4.08K total, $4.03K from shorts, and $47.31 from longs.
The 12-hour window flips toward longs, with $27.67K total liquidated, $19.40K from longs against $8.27K from shorts.
Across 24 hours, the total reaches $168.55K, and shorts dominate again at $130.35K versus $38.21K from longs, a pattern worth comparing against the setup in BNB rally analysis.
Source: $BNB liquidation data, CoinGlass, checked August 4, around 12:49 PM IST.
BNB Price Prediction: Will Binance Coin Break Above $600?
A close above $596.64 (previous swing high ) would confirm continuation toward $602.78, roughly 2.1% higher, and then the extended zone near $632.77, about 7.2% above the current price. 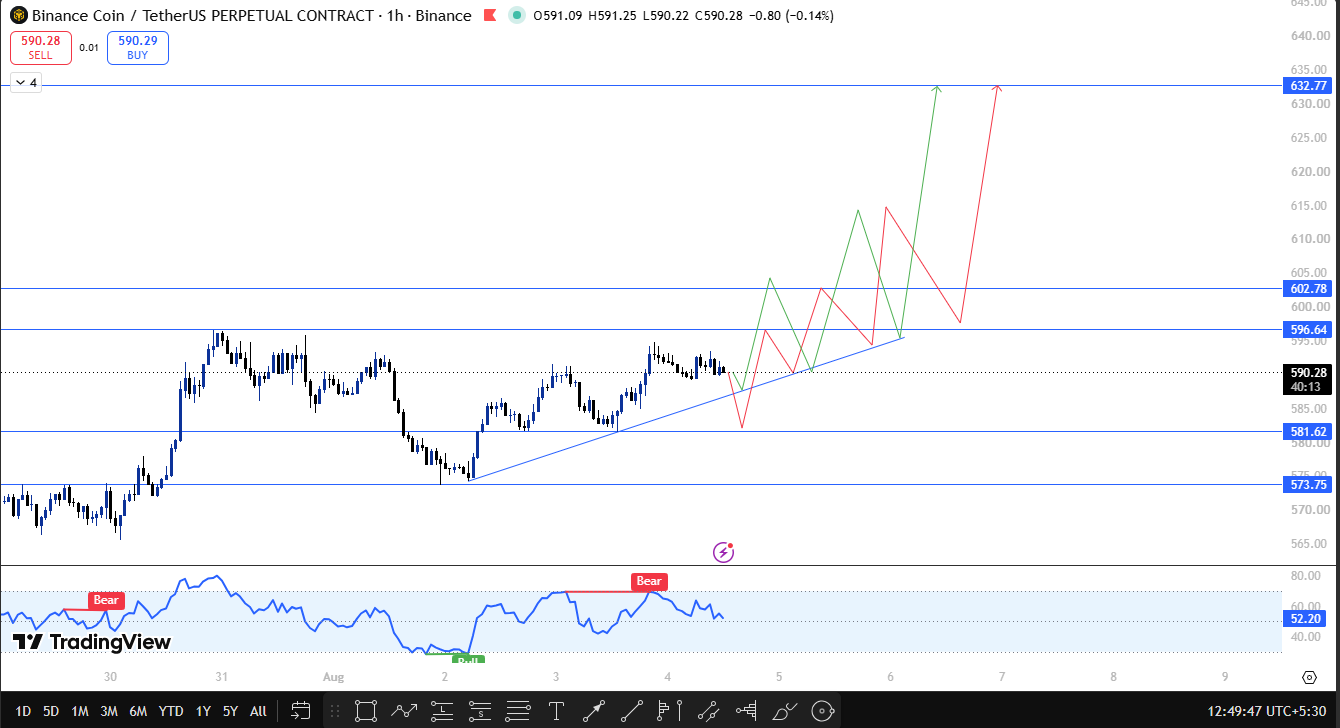
A rejection here instead points back to the trendline or $581.62 as the next support to watch.
$BNB has been climbing along its rising trendline for days, treating every dip as a buying zone rather than breaking down.
The chart's built-in RSI sits at 52.20, well off the bear tags it printed twice earlier, suggesting the recent pullbacks have been shallow rather than a real trend change.
If price holds above the trendline or retests $581.62 and bounces, the same $596.64 to $632.77 path stays open, a scenario also framed in the BNB Pasteur upgrade breakout.
A break and close below $573.75 would weaken this structure and call for a fresh look at the chart.
Binance coin Technical Outlook Snapshot
Indicator | Signal |
Trend | Ascending trendline holding as support |
Structure | Testing the $596.64 zone for the first time since the bounce |
RSI | Reading 52.20, no active Bear tag |
Liquidations | Shorts led the 1h, 4h, and 24h windows; longs led the 12h window. |
Binance coin Support and Resistance Levels to Track
Type | Level | Note | % From CMP |
Extended Target | $632.77 | Reachable after clearing $602.78 | +7.20% |
Resistance 2 | $602.78 | Second target on continuation | +2.12% |
Resistance 1 | $596.64 | Immediate test zone | +1.08% |
Current Price | $590.28 | Trading just under resistance | - |
Support 1 | $581.62 | Pullback retest zone | -1.47% |
Support 2 | $573.75 | Trendline-based, structured risk below | -2.80% |
Risk-Reward Table
Case | Trigger | Target |
Bull Case | Closes above $596.64 | Move toward $602.78, then $632.77. |
Pullback-Hold Case | Retests the trendline of $581.62 and holds | The same upside targets remain valid. |
Bear Case | Closes below $573.75 | Structure weakens; fresh levels needed. |
What Would Change This BNB Outlook
Holding the trendline at $581.62 keeps the bullish structure intact. A confirmed close below $573.75 would break that structure and shift focus lower.
False breaks near $596.64 are possible too, so a quick reversal back under it after a brief push higher would weaken the case even without losing $581.62.
Leveraged positions near these zones carry added risk given how tight the range has been.
How Bitcoin Sets the Tone for Binance coin
Bitcoin still shapes how far a move like this can extend.
A steady Bitcoin generally supports BNB working through $596.64 toward $602.78 and $632.77, a broader question also covered in the BNB scenario outlook analysis.
A weaker Bitcoin tape raises the odds $BNB stalls under resistance even with the trendline intact.
When This Binance coin Setup Gets Revisited
This setup will be revisited on a confirmed close above $596.64 or below $573.75, or if no breakout confirms within 24 hours.
Readers can also track the BNB price prediction today for the latest update.
Glossary
Ascending Trendline: A rising line connecting higher lows, used to track support during an uptrend.
Open Interest: Total value of derivative contracts still open and unsettled. Liquidation: The forced closing of a leveraged position when margin runs out.
CoinGabbar's Technical Analyst View
Bull Case: A close above $596.64 opens $602.78 and then $632.77, backed by the trendline holding and shorts leading the 24-hour liquidations.
Base Case: $BNB gets rejected near $596.64, retests the trendline at $581.62, and holds for another attempt.
Bear Case: A close below $573.75 breaks the structure and calls for fresh downside levels. For more setups like this, see more price forecasts.
Disclaimer
This Binance coin price prediction is based on technical chart analysis and market data available at the time of writing. Cryptocurrency markets are highly volatile, and prices can change rapidly. This content is for informational purposes only and should not be considered financial advice. CoinGabbar and the analyst do not hold a position. Always do your own research and consult a qualified financial advisor before making any investment decisions.


















