CHUMP Price Prediction: What Happens Next After This Explosive Rally?


Chump Coin just went wild this week, and the reason behind the surge might surprise you. What is really driving it?
Why Chump Coin Suddenly Became the Talk of Crypto Twitter
CHUMP price prediction searches spiked this week as Chump Coin pulled off one of the sharper memecoin moves on Robinhood Chain. It's not every day a token doubles from its recent lows and still finds buyers willing to chase it higher.
The coin, styled around a rooster mascot and a "Make Memecoins Great Again" theme, leaned hard into Trump-era meme culture. That combination of humor and timing clearly struck a nerve.
Memecoins live and die on attention, and $CHUMP has been getting plenty of it lately. A fresh exchange listing added visibility, and a scheduled community call kept the chatter alive all week.
But attention alone doesn't guarantee staying power. This is where daily chart analysis and monthly chart analysis start to matter, because technical structure will decide whether this rally has legs. So where does $CHUMP actually stand right now, and what would it take for the bullish momentum to continue?
Why Is $CHUMP Price Moving Today?
Chump Coin's rally didn't happen in a vacuum. The token landed a spot on crypto exchange listing coverage after LBank added CHUMP to its spot board on August 29, and that kind of exchange access tends to pull in fresh capital fast.
$CHUMP launched on Robinhood Chain with a fixed 1 billion token supply, zero buy or sell taxes, and a renounced contract. Traders tend to like seeing those boxes checked.
The excitement didn't stay confined to the exchange. Chump Coin's own team kept the momentum alive with a public trading update about co-founder buying activity, and that kind of visible conviction tends to pull more eyes in.
And it's not just the listing. A community X Space scheduled for September 1 kept engagement high through the week. Co-founder activity, including a public post about buying into the token, added a layer of conviction some holders found reassuring.
Turns out, market sentiment around CHUMP is running hot right now, with trading volume up over 130% in a single day. That's not something you see with a token nobody cares about.
Some of that buzz traces straight back to the official LBank announcement, which flagged the zero-tax structure and locked liquidity right out of the gate.
CHUMP Price Today: Market Snapshot (September 1, 2026, 05:35 UTC)
As of September 1, 2026, near 05:35 UTC, CHUMP is trading around $0.0290, up more than 46% over the past 24 hours, according to CoinMarketCap data.
Market cap: $29 million, up 46.18% in 24 hours
24-hour trading volume: $5 million, up over 137%
Volume-to-market-cap ratio: 16.89%
Fully diluted valuation: $29 million
Liquidity-to-market-cap ratio: 2.31%
Circulating and total supply: 1 billion CHUMP, fully circulating
24-hour range: $0.01921 to $0.03475
All-time high: $0.03475, hit September 1, 2026
All-time low: $0.00286, set August 21, 2026
That range alone tells a story. Big swings, thin liquidity, fast money, all while the broader crypto market stayed comparatively calm. Not exactly a boring chart.
$CHUMP Technical Analysis: Daily and 4-Hour Chart Structure
Pulling up the 4-hour chart, $CHUMP is trading near $0.0296, after opening the session around $0.0284 and tapping a high of $0.0297.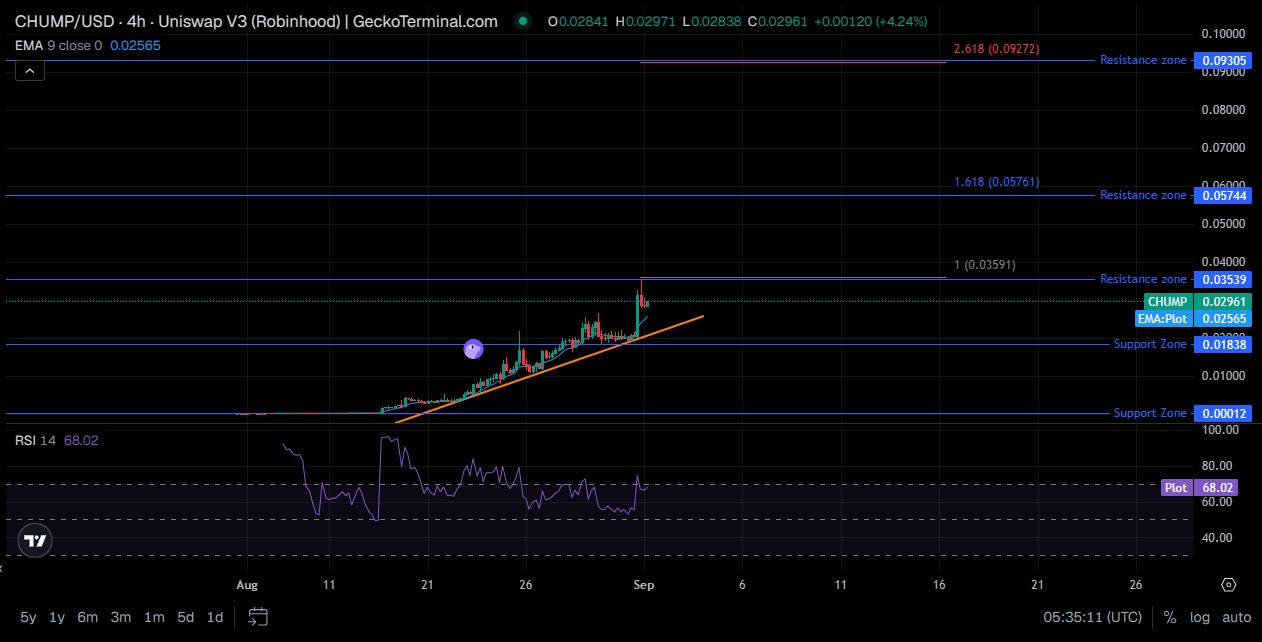
The token's 9-period EMA sits near $0.0257, well below current trades. That gap tells you momentum has been running ahead of the average lately.
RSI on the 14-period reading sits at 68.02. Approaching overbought, but not quite there yet.
When we pulled up the Fibonacci extension drawn from the recent base, the first thing that stood out was how far trades had already pushed past the 1.0 extension near $0.03539, which now flips into a resistance zone rather than a target.
Basically, the chart shows a token in strong bullish momentum, riding an ascending trendline since mid-August. But it's stretched enough that a cooldown toward the trendline or the EMA wouldn't shock anyone.
Short-term structure favors bulls. Sustainability is the real test.
Support and Resistance Levels $CHUMP Traders Are Watching
Immediate support: $0.01838, with a deeper structural floor near $0.00012
Near-term resistance: $0.03539, the 1.0 Fibonacci extension and current ceiling
Secondary resistance: $0.05744, the 1.618 extension
Extended resistance: $0.09305, the 2.618 extension
If bulls clear $0.03539 on strong trading volume, the path toward $0.05744 opens up fairly quickly. Lose the $0.01838 zone, though, and the whole price outlook shifts bearish in a hurry. Traders timing entries around news often cross-check dates on a community events calendar before committing.
$CHUMP Holder Distribution and Tokenomics Snapshot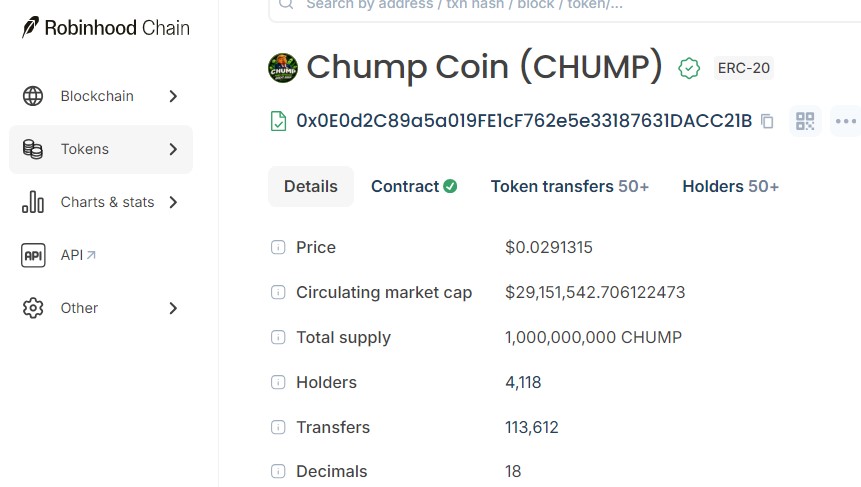
Chump Coin currently has just over 4,100 holders, based on data from Robinhood Chain's block explorer. Anyone comparing this setup to past launches knows tokenomics and presale risks can matter just as much as the chart.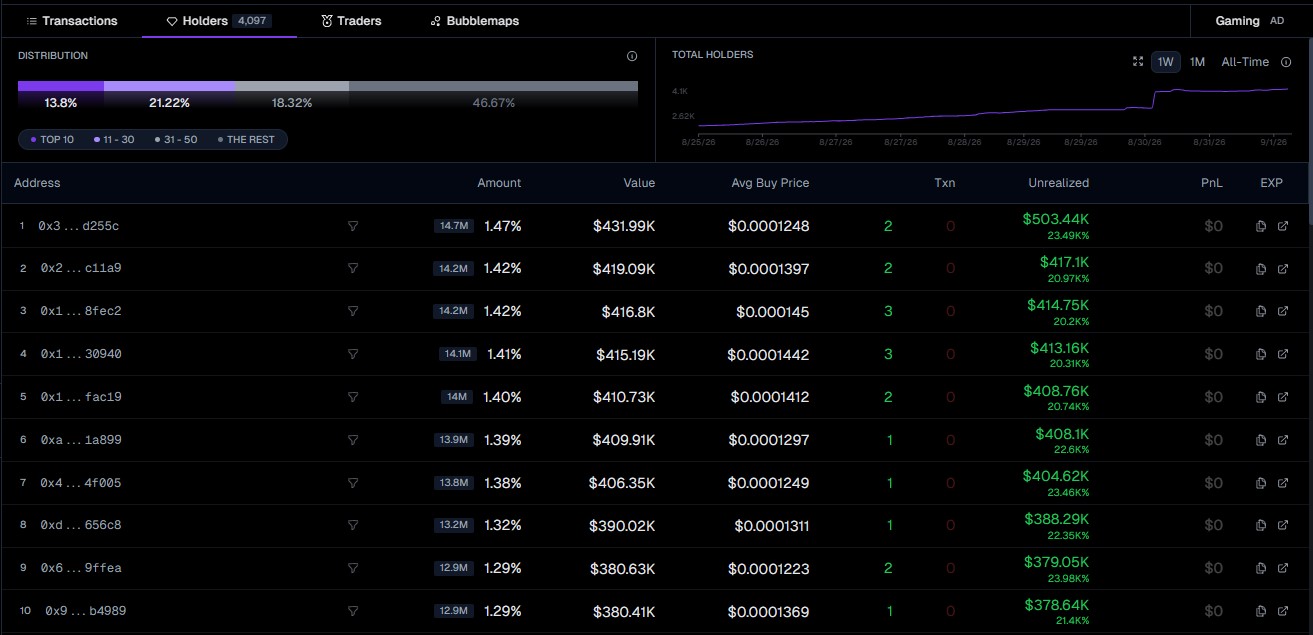
Distribution looks fairly spread for a young memecoin: the top 10 wallets hold 13.8%, wallets ranked 11 to 30 hold 21.22%, the 31-to-50 group holds 18.32%, and the remaining holders control 46.67%.
That's not a whale-dominated setup. But concentration among the top 60 wallets still near 53% means large sells could move price fast.
Is CHUMP Just Another Memecoin, or Does It Have Staying Power?
CHUMP fits squarely in the memecoin category, and that label matters for anyone reading a CHUMP price prediction with real money on the line.
Memecoins run on narrative, community energy, and exchange visibility more than fundamentals. $CHUMP has all three right now: a viral mascot, an active memecoin crypto news cycle around it, and a fresh listing pulling in new eyes.
That's the upside case.
But memecoin rallies fade fast when attention moves elsewhere, and low liquidity relative to market cap (2.31% here) means exits can get messy during a sharp reversal. Anyone tracking this space alongside broader crypto news today knows the pattern repeats often.
CHUMP Price Prediction: Bear, Base, and Bull Scenarios
Timeframe | Bear Case | Base Case | Bull Case | Probability | Invalidation |
7 Days | $0.0184 | $0.0270 | $0.0354 | Bear 25% / Base 50% / Bull 25% | Loss of $0.0184 support |
30 Days | $0.0120 | $0.0354 | $0.0574 | Bear 30% / Base 45% / Bull 25% | Sustained break below $0.0184 |
Early 2027 | $0.0060 | $0.0400 | $0.0930 | Bear 35% / Base 40% / Bull 25% | Liquidity or volume collapse |
This CHUMP price prediction table isn't a guarantee. It's a probability map built off current structure, and structure changes fast in this corner of the market.
What Could Invalidate the $CHUMP Bullish Case?
A daily trading session that closes decisively below $0.01838 would flip short-term structure bearish. Add in outside factors like macro trade risk, and the picture gets shakier fast. That's the line in the sand for now.
A sharp drop in trading volume, especially with volume-to-market cap already thin, would signal fading interest fast.
And any coordinated sell-off from the top wallet cluster, holding over 13% of supply between them, could pressure price well before technical levels even matter. Broader market stress tied to macro headlines, like the ones covered in Clarity Act news, can also drag smaller-cap tokens down regardless of their own chart.
Conclusion: CHUMP Price Outlook From Here
Right now, $CHUMP sits in a classic memecoin setup, the kind that keeps showing up across AI-driven crypto trends and social-first tokens alike: strong short-term bullish momentum, an RSI creeping toward overbought, and a market cap still small enough to move on a single wallet's decision.
The base case over the next month points toward consolidation near the $0.035 resistance zone. The bull case needs a clean breakout on real trading volume, not just hype.
Is this the next breakout meme coin or a fast fade waiting to happen? For a wider price prediction outlook across the market, the next few trading sessions should make CHUMP's own path a lot clearer.
Disclaimer
This article is for informational purposes only and does not constitute financial, investment, or trading advice. Cryptocurrency markets, and memecoins in particular, are highly volatile and carry significant risk of loss. Prices and data referenced here reflect a specific point in time (September 1, 2026, near 05:35 UTC) and can change rapidly. Always do independent research and consult a licensed financial advisor before making any investment decisions.
Also read:
















