Curve DAO Token Price Prediction: $CRV Rally, Emissions Cut Incoming?


CRV is surging, and traders who caught the breakout are already eyeing the next resistance zone.
This Curve DAO Token price prediction lands right as the price rips above a months-long descending trendline on a sharp green candle, with volume and liquidations both spiking alongside the move.
Over the next one to two weeks, the bullish case builds as long as CRV holds above $0.23929, while a slip back under that level would put the breakout attempt at risk.
With RSI already stretched and shorts getting squeezed hard, here's what the chart and derivatives data show.
Market data was checked on August 11, 2026, at 14:54 IST.
Curve DAO Token Price Prediction Today: Market Overview
Metric | Value |
Price | $0.26272 |
24h Change | +11% |
Market Cap | $400.23M |
FDV | $788.15M |
24h Volume | $119.5M |
Vol/Mkt Cap (24h) | 29.72% |
Liquidity/Mkt Cap | 0.69% |
Total Supply | 2.4B CRV |
Max Supply | 3.03B $CRV |
Circulating Supply | 1.53B $CRV |
Holders | 274.21K |
Source: Data from CoinGecko as of August 11, 2026, at 14:54 IST. Figures may vary slightly across other tracking websites.
Curve DAO Token News: Emissions Cut Incoming
A post from CrediBULL Crypto flagged that CRV's annual emissions reduction of around 15% is set to trigger in roughly two days, which would drop the token's inflation rate to 4.02%. 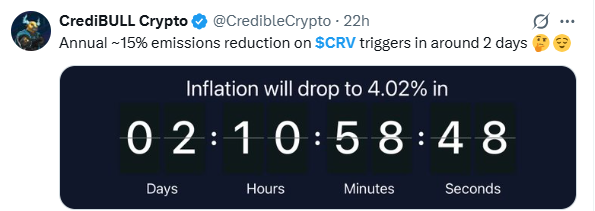
Source: Data From X
Note: CoinGabbar could not independently verify the exact on-chain trigger mechanism or date behind this claim, so it's worth treating the timeline as reported rather than confirmed.
Curve DAO Token News: CRV Leads Gainers on a Red Day
A separate post from BSCN noted that CRV rose 9% over 24 hours to lead major tokens even as the broader market slipped slightly, stretching its weekly gain to 26%. 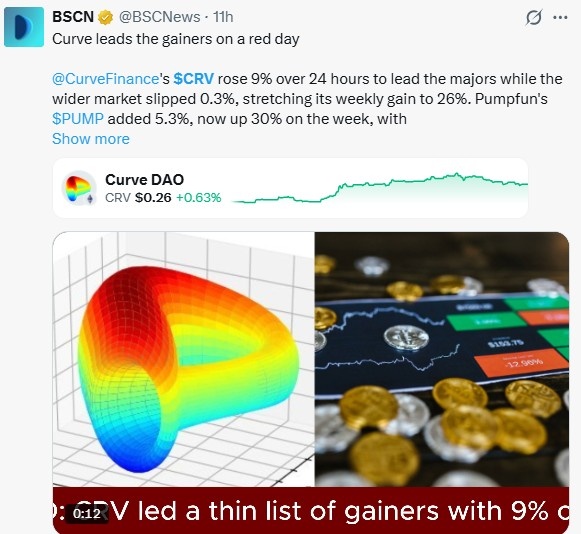
Source: Data From BSCN
This kind of relative strength on a weak market day often draws extra attention from traders looking for tokens showing independent momentum.
Curve DAO Token Liquidation and Volume Data
This section covers futures market data from Coinglass, kept separate from the spot volume figures above.
Liquidations (Long vs. Short)
Timeframe | Total | Long | Short |
1h | $3.62K | $3.16K | $455.49 |
4h | $23.57K | $22.35K | $1.22K |
12h | $227.41K | $50.82K | $176.59K |
24h | $586.73K | $80.75K | $505.98K |
Short liquidations dominate the 12h and 24h windows by a wide margin, showing traders positioned against CRV got squeezed hard as price broke above the downtrend.
The 1h and 4h windows flip to mostly long liquidations, suggesting some of the immediate breakout buyers have been shaken out on the pullback from the highs.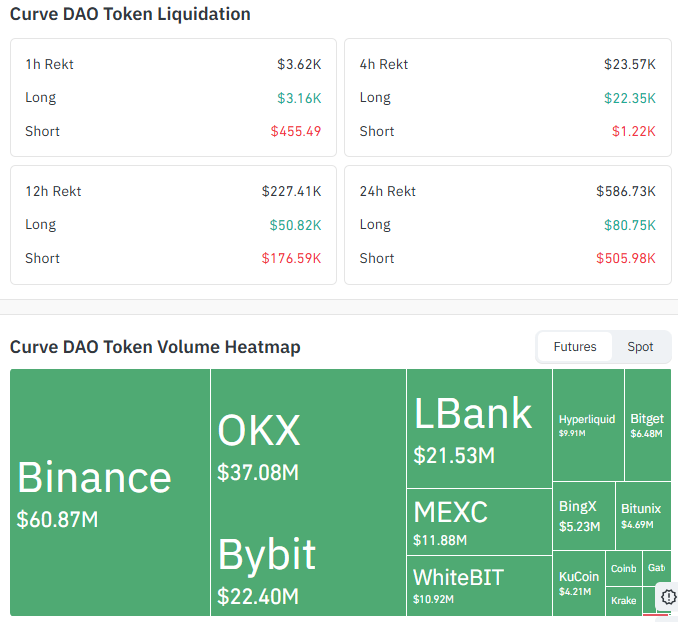
Source: Data From CoinGlass
Futures Volume by Exchange
Exchange | Volume |
Binance | $60.87M |
OKX | $37.08M |
Bybit | $22.40M |
LBank | $21.53M |
Binance and OKX together handle a large share of tracked futures volume, with activity spread fairly widely across a long list of smaller exchanges too.
Curve DAO Token Price Prediction Chart: Technical Analysis
Pair: CRV/USD · Market: Spot (Crypto) · Exchange: TradingView Crypto Index · Timeframe: 1D · Source: TradingView · Timestamp: August 11, 2026, 14:54 UTC+5:30
CRV is trading at $0.26272, the bigger story is the descending trendline that had capped price since the May highs, which price broke through decisively on this move.
That trendline had held for months, rejecting multiple rally attempts along the way, so a clean break above it on strong volume is a meaningful shift.
The EMA (Exponential Moving Average, an indicator that tracks the average price over a set number of candles and reacts faster to recent price moves) 20 sits at $0.22191 and the EMA 50 at $0.21611, both now well below the current price, confirming the short-term trend has turned upward.
RSI is reading 78.09, firmly in overbought territory, which means a cooldown or pullback wouldn't be surprising even within a genuine trend shift.
Price is trading at an important level. If it breaks the upper resistance and holds, we can assume trend continuation, backed by a bullish EMA crossover of the 9 and 20.
As long as the price stays above the EMAs, the trend remains bullish. If it breaks support and trades below the EMAs, we can say the trend has changed.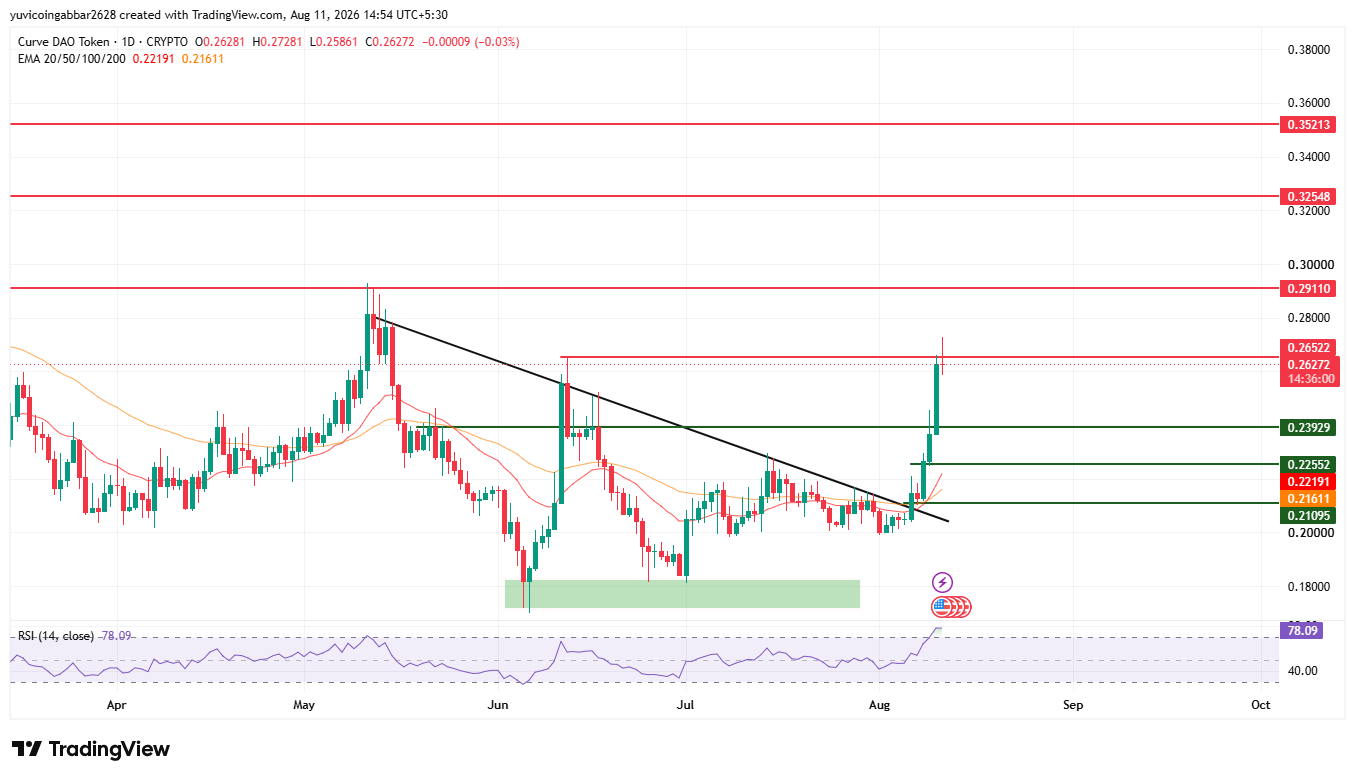
Support and Resistance Levels
Level Type | Price |
Resistance 4 | $0.35213 |
Resistance 3 | $0.32548 |
Resistance 2 | $0.29110 |
Resistance 1 (nearest) | $0.26522 |
Immediate Price Reference | $0.26272 |
First Confirmed Support | $0.23929 |
Deeper Support | $0.22552 |
Structural Floor | $0.21095 |
EMA Levels
EMA | Price |
EMA 20 | $0.22191 |
EMA 50 | $0.21611 |
Curve DAO Token Forecast: Bull Case vs. Bear Case
CRV price target 2026 Bull case: Holding above $0.23929 and the EMA cluster near $0.21611 to $0.22191 keeps the trendline breakout intact.
A confirmed close above the nearest resistance at $0.26522 would open the path toward $0.29110 and eventually $0.32548 and $0.35213.
CRV price target 2026 Bear case: A drop back below $0.23929 would put the trendline breakout in doubt and suggest the sharp move was a short squeeze rather than a genuine trend change.
Losing $0.22552 would expose the structural floor at $0.21095 as the next downside target.
CRV price target: Can CRV Reach $0.35213?
$0.35213 is the highest resistance level marked on the chart.
Getting there would require CRV to first hold above $0.23929, clear the nearest resistance at $0.26522, and then push through $0.29110 and $0.32548 in turn.
With RSI already at 78.09, that kind of run would likely need to pause and consolidate somewhere along the way rather than happen in one continuous move.
What Could Invalidate the Bullish Setup?
A rejection at $0.26522 followed by a daily close back below $0.23929 would call the trendline breakout into question. A deeper break through $0.22552 down to the $0.21095 structural floor would undo the recent recovery and suggest the breakout has failed.
Curve DAO Token Price Prediction: Expert View
According to CoinGabbar analysts, the break above a multi-month descending trendline on a high-volume candle is a real technical shift, and the scale of short liquidations over the past 24 hours shows sellers were caught leaning the wrong way.
RSI at 78.09 does raise the risk of a near-term pullback or consolidation before any further push higher.
The $0.23929 to $0.26522 zone is the one to watch next: holding it would keep the breakout thesis intact, while losing $0.23929 would suggest this move was more of a short squeeze than a lasting trend change.
Curve DAO Token Price Prediction: Data Sources
Price, EMA, and RSI data referenced from a 1D CRV/USD chart via TradingView, timestamped August 11, 2026, 14:54 UTC+5:30.
Market cap, FDV, volume, and supply data referenced from a crypto market tracker (CoinMarketCap/CoinGecko-style source).
Liquidation and futures volume data referenced from Coinglass. Emissions reduction claim was reported via a post from CrediBULL Crypto on X.
Weekly performance figures reported via a post from BSCN on X.
Disclaimer: This piece is for informational purposes only and isn't financial advice. The levels and scenarios above are based on technical chart analysis and publicly available data at the time of writing, and crypto markets can move sharply within hours, so past patterns don't guarantee future outcomes. It's worth doing independent research and considering your own risk tolerance before acting on any of the levels discussed here.

















