Curve DAO Token Price Prediction: $CRV Eyes $1 After Major Breakout?

$CRV just jumped over 17% in a day, and short sellers are getting hit hard.
This Curve DAO Token price prediction comes as buyers rush back in and trading volume spikes fast.
Traders on social media are calling this one of the strongest charts they've seen in a while.
If you missed CRV during the long slow drop, this pump might feel like the one you can't ignore. Is this just the start, or a fast top before a fall?
Market data was checked on September 1, 2026, at 10:48 IST.
Curve DAO Token Price Prediction Today: Market Overview
Metric | Value |
Price | $0.36185 |
24h Change | +17.10% |
Market Cap | $554.08M |
FDV | $1.08B |
24h Volume | $105M+ |
Vol/Mkt Cap (24h) | 19.02% |
Liquidity/Mkt Cap | 0.61% |
Total Supply | 2.41B CRV |
Max Supply | 3.03B CRV |
Circulating Supply | 1.54B CRV |
Holders | 274.14K |
Source: Data from CoinMarketCap as of September 1, 2026, at 10:48 IST. Figures may vary slightly across other tracking websites.
Liquidation and Volume Data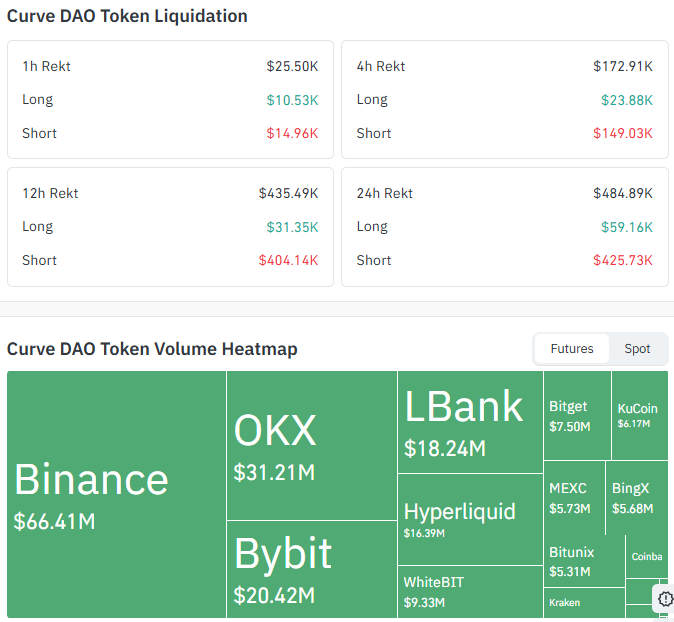
Window | Total Rekt | Long | Short |
1h | $25.50K | $10.53K | $14.96K |
4h | $172.91K | $23.88K | $149.03K |
12h | $435.49K | $31.35K | $404.14K |
24h | $484.89K | $59.16K | $425.73K |
This is Coinglass futures liquidation data, kept separate from the spot volume above.
Futures volume by exchange over 24h: Binance $66.41M, OKX $31.21M, Bybit $20.42M, LBank $18.24M, Hyperliquid $16.39M, WhiteBIT $9.33M, Bitget $7.50M, KuCoin $6.17M, MEXC $5.73M, BingX $5.68M, Bitunix $5.31M, with smaller volume spread across Coinbase and Kraken.
$CRV Community Buzz: What Traders Are Saying on X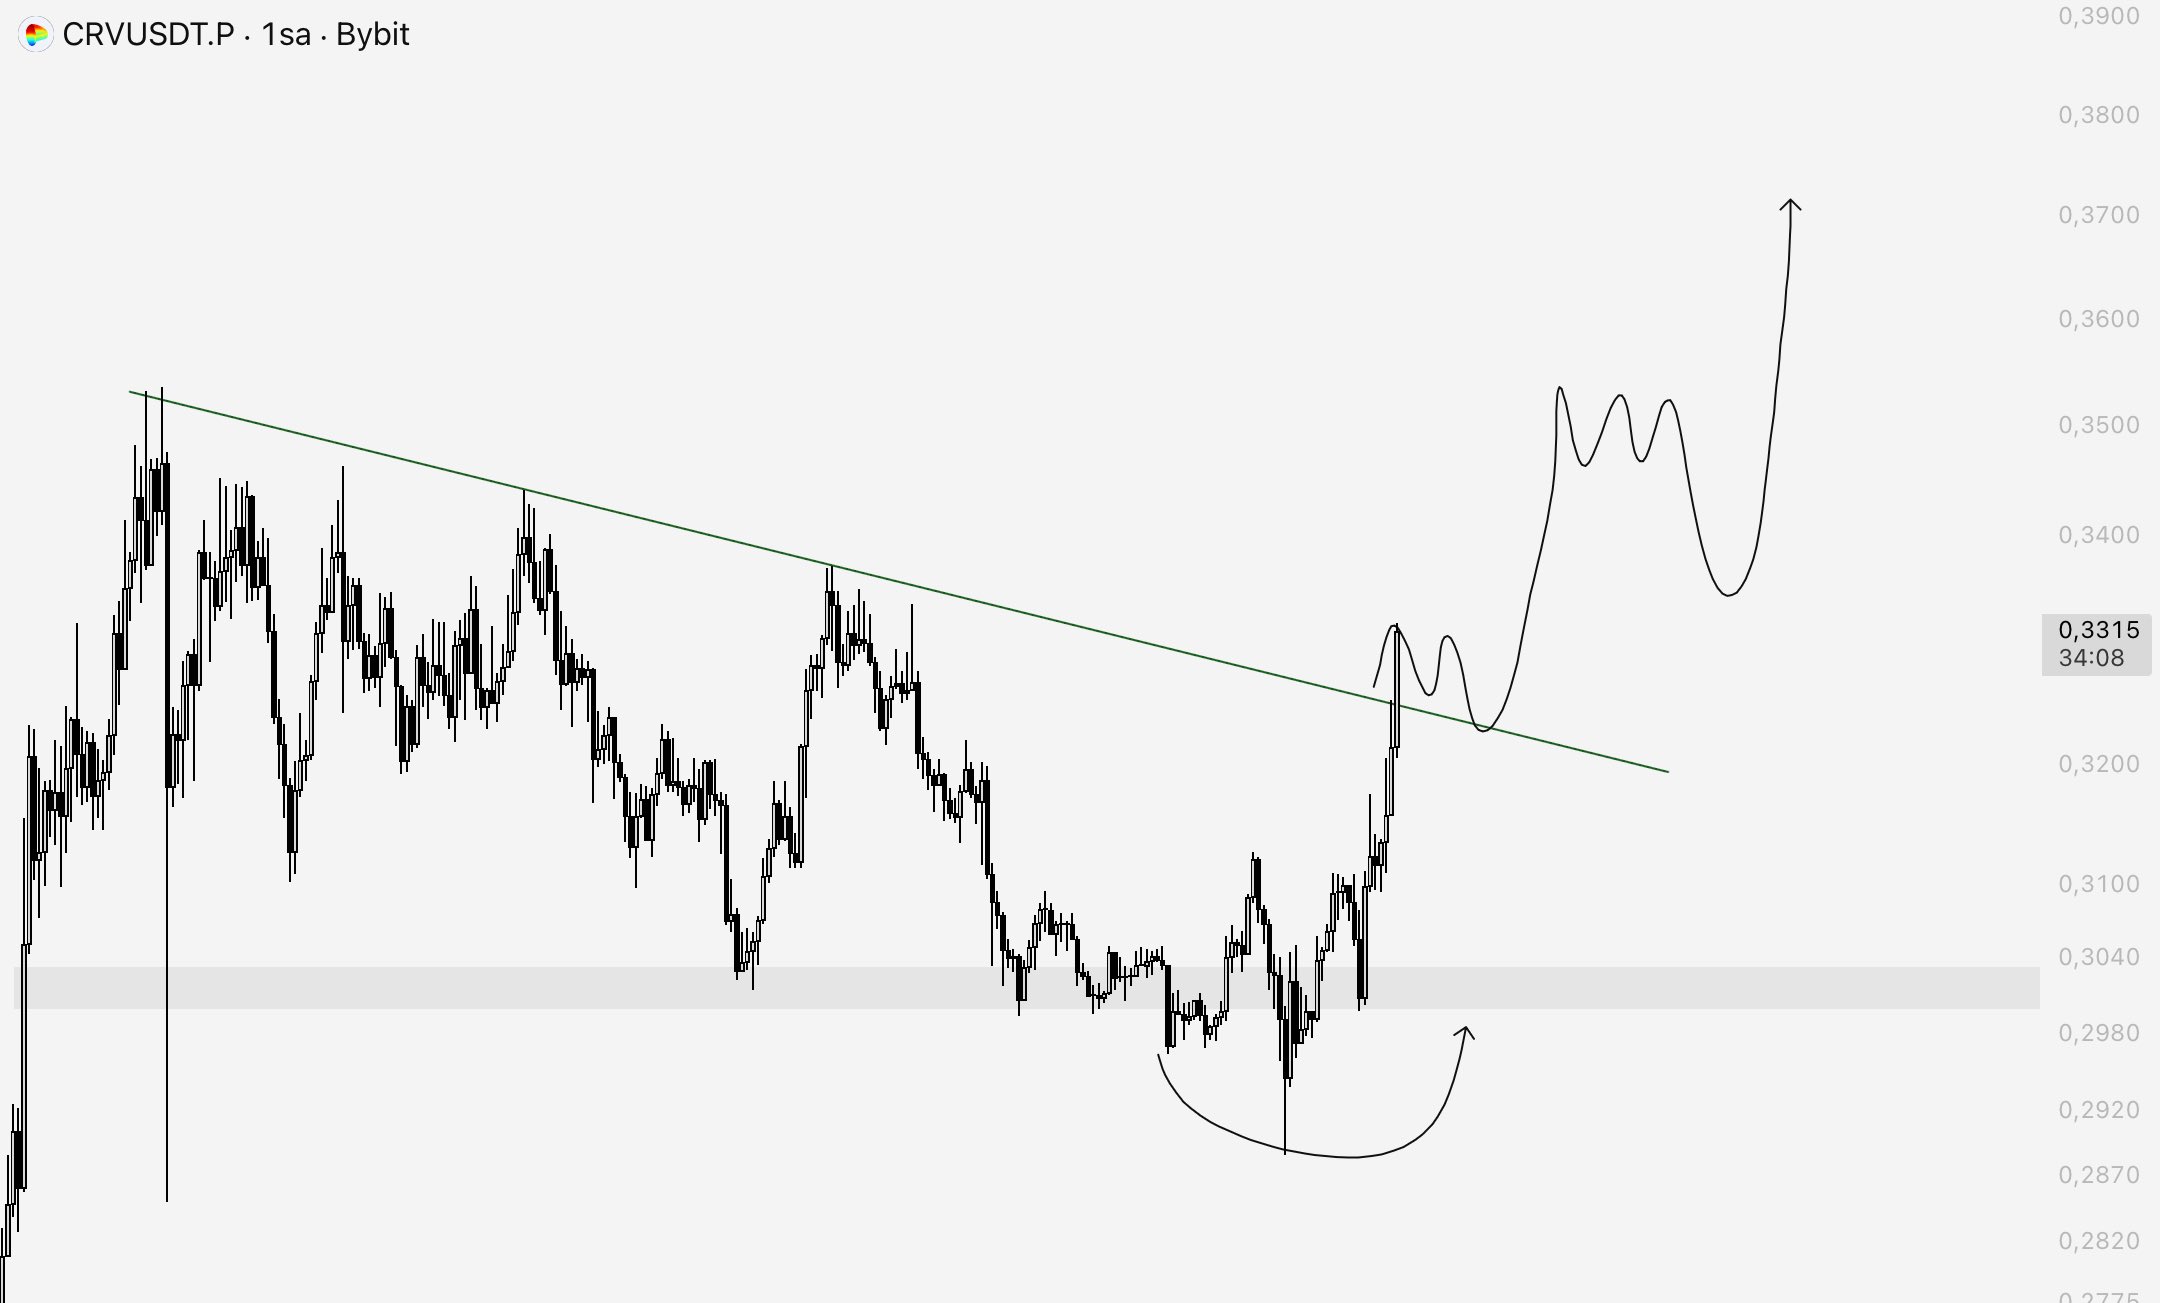
Source: Data From X
A trader on X called CRV's 4H chart one of the rare setups in the market showing strong volume and said they're watching the 4H close closely.
Note: This is a social media observation, not confirmed data, and CoinGabbar could not independently verify the claim beyond the trader's own post.
Curve DAO Token Price Prediction Chart: Technical Analysis
Pair: CRV/USDT · Market: Spot (Crypto index) · Timeframe: 1D · Source: TradingView · Timestamp: September 1, 2026, 10:48 UTC+5:30
CRV is trading at $0.36185, after breaking sharply higher off a multi-month downtrend.
Price confirms the breakout after closing above the $0.35208 support level, and holding above that can continue the bullish momentum and rally.
The EMA cluster sits well below the spot, with the 20 EMA at $0.30021 and the 50 EMA at $0.26484, both now acting as distant support rather than resistance.
RSI (14) reads 69.87 against its 68.02 average, putting CRV close to overbought after this move.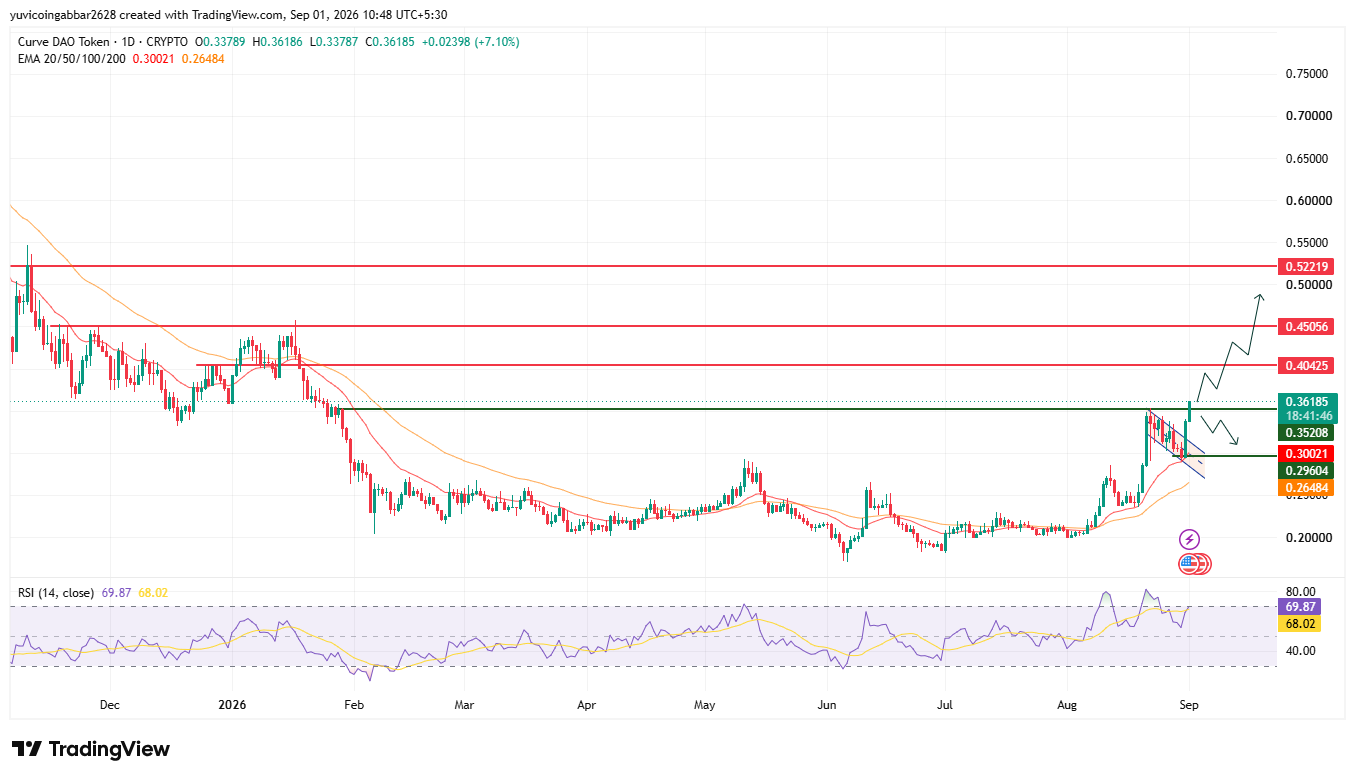
Curve DAO Token Price Prediction: Key Levels
Level Type | Price |
Resistance 3 | $0.52219 |
Resistance 2 | $0.45056 |
Resistance 1 (nearest) | $0.40425 |
Immediate Price Reference | $0.36185 |
First Confirmed Support | $0.35208 |
Deeper Support | $0.29604 |
$CRV Forecast: Bull Case vs Bear Case
Bull case: Holding above $0.36185 and clearing the nearest resistance at $0.40425 would confirm buyers are still in control after this move.
A confirmed break there opens the path toward $0.45056 and eventually $0.52219.
Bear case: RSI at 69.87 leaves CRV close to overbought, and a rejection at $0.40425 followed by a slide back below $0.35208 would suggest this was a squeeze rather than a trend change, exposing $0.29604 next.
$CRV Price Scenarios: Triggers and Invalidation
Scenario | Trigger | Likely Outcome | Invalidation Point |
Breakout continuation (bullish) | Daily close above $0.40425 | Move toward $0.45056, then $0.52219 | Close back below $0.36185 |
Consolidation (hold) | Price holds between $0.35208 and $0.40425 | Range-bound chop before the next leg | Break of either boundary |
Breakdown (bearish) | Daily close below $0.35208 | Drop toward $0.29604 | Reclaim above $0.35208 |
Can $CRV Reach $1?
$0.52219 is the highest resistance marked on the chart.
Getting there would need CRV to first clear $0.40425, then hold above $0.45056, a multi-stage move rather than a single leg, especially with RSI already close to overbought.
Long-term view: If CRV clears the key resistance levels and sustains the breakout, the $1 level could become a realistic long-term upside milestone.
However, this would depend on continued DeFi growth and strong buying demand.
Curve DAO Token Price Prediction: Expert View
According to CoinGabbar analysts, the liquidation skew toward shorts suggests this rally has been squeeze-driven rather than a confirmed trend change.
$0.36185 to $0.40425 is the zone that decides whether it holds or fades.
Disclaimer
This piece is for informational purposes only and isn't financial advice. The levels and scenarios above are based on technical chart analysis and publicly available data at the time of writing, and crypto markets can move sharply within hours. Do your own research and consider your own risk tolerance before acting on anything discussed here.
Also read:
















