DGrid AI Price Prediction: Can DGAI Rally Hold After New Listings?

DGrid AI Coin: Rally Cools, But Is the Bigger Move Still Ahead?
Something unusual is happening with a small AI crypto token right now, and traders are trying to figure out if it is the start of something bigger or just noise. DGrid AI has spent the last day doing what most coins only dream about. So where does this leave anyone searching for a DGrid AI price prediction September 2026 today, and what happens if the move fades as fast as it came?
Why Is Everyone Suddenly Watching DGAI?
DGrid AI did not creep into this conversation quietly. It arrived with a jump nobody was fully ready for.
There is a pattern here. New listings, staking launches, and a token still finding its price tend to collide at once, a setup that keeps showing up across crypto news today.
Turns out, there is more than one reason people are talking. But before the numbers, is this the kind of move that holds or the kind that snaps back just as fast?
DGrid AI Price Prediction: Where Does DGAI Stand Right Now?
As of roughly 11:30 UTC on August 25, 2026, DGAI is trading near $0.6986, up 75.7% over the past 24 hours, with a market capitalization near $107.023 million and a fully diluted valuation around $713.488 million, according to CoinGecko.
Daily trading volume sits close to $147.3 million, heavy for a token this size. The 24-hour range runs from $0.3642 to $0.8462, and both the all-time high and low were set within the last day, a sign of fresh price discovery.
The circulating supply is 150 million DGAI against a fixed 1 billion max supply, so most of the token has not entered the market yet, a detail that matters for a longer price outlook.
Why Is DGAI Price Moving Today?
This is not a random pump. A few things landed close together. Gate opened futures trading on $DGAI with up to 20x leverage, a fresh exchange listing that pulled in short-term traders fast.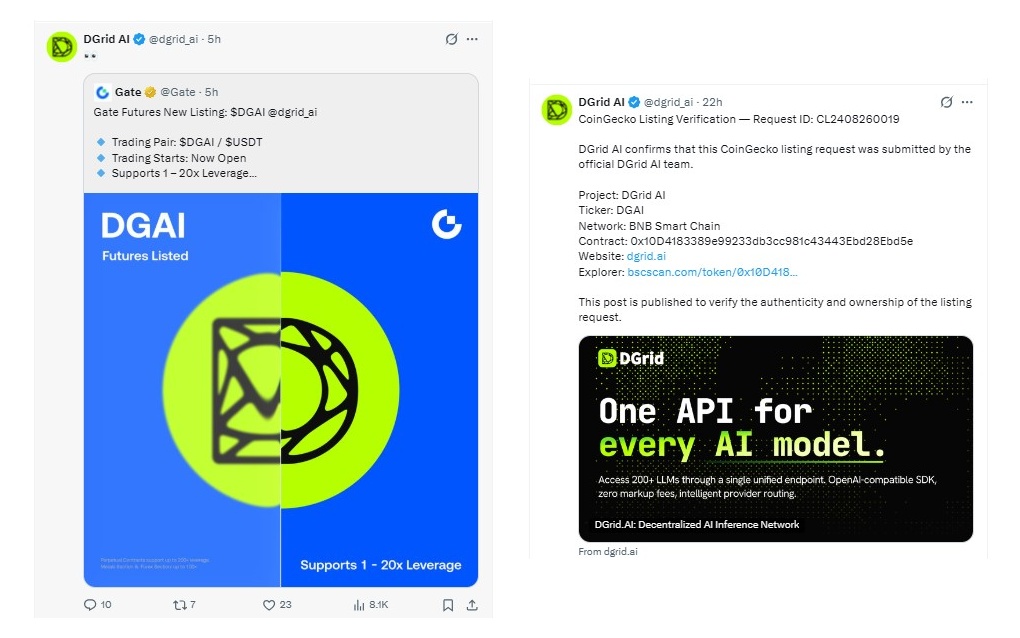
Premium $DGAI rewards also went live, offering $300 a month in AI model credits on top of on-chain accrual, alongside validator staking paying 60% APY over 180 days and 90% APY over 360 days.
DGAI also expanded to Arbitrum with bridging through Wormhole, another liquidity venue worth tracking on the coin events calendar.
Technical Analysis: What the Chart Is Actually Saying
On the 1-hour chart tracked on MEXC via TradingView Chart, DGAI trades around $0.6984 after tagging a high near $0.8503. 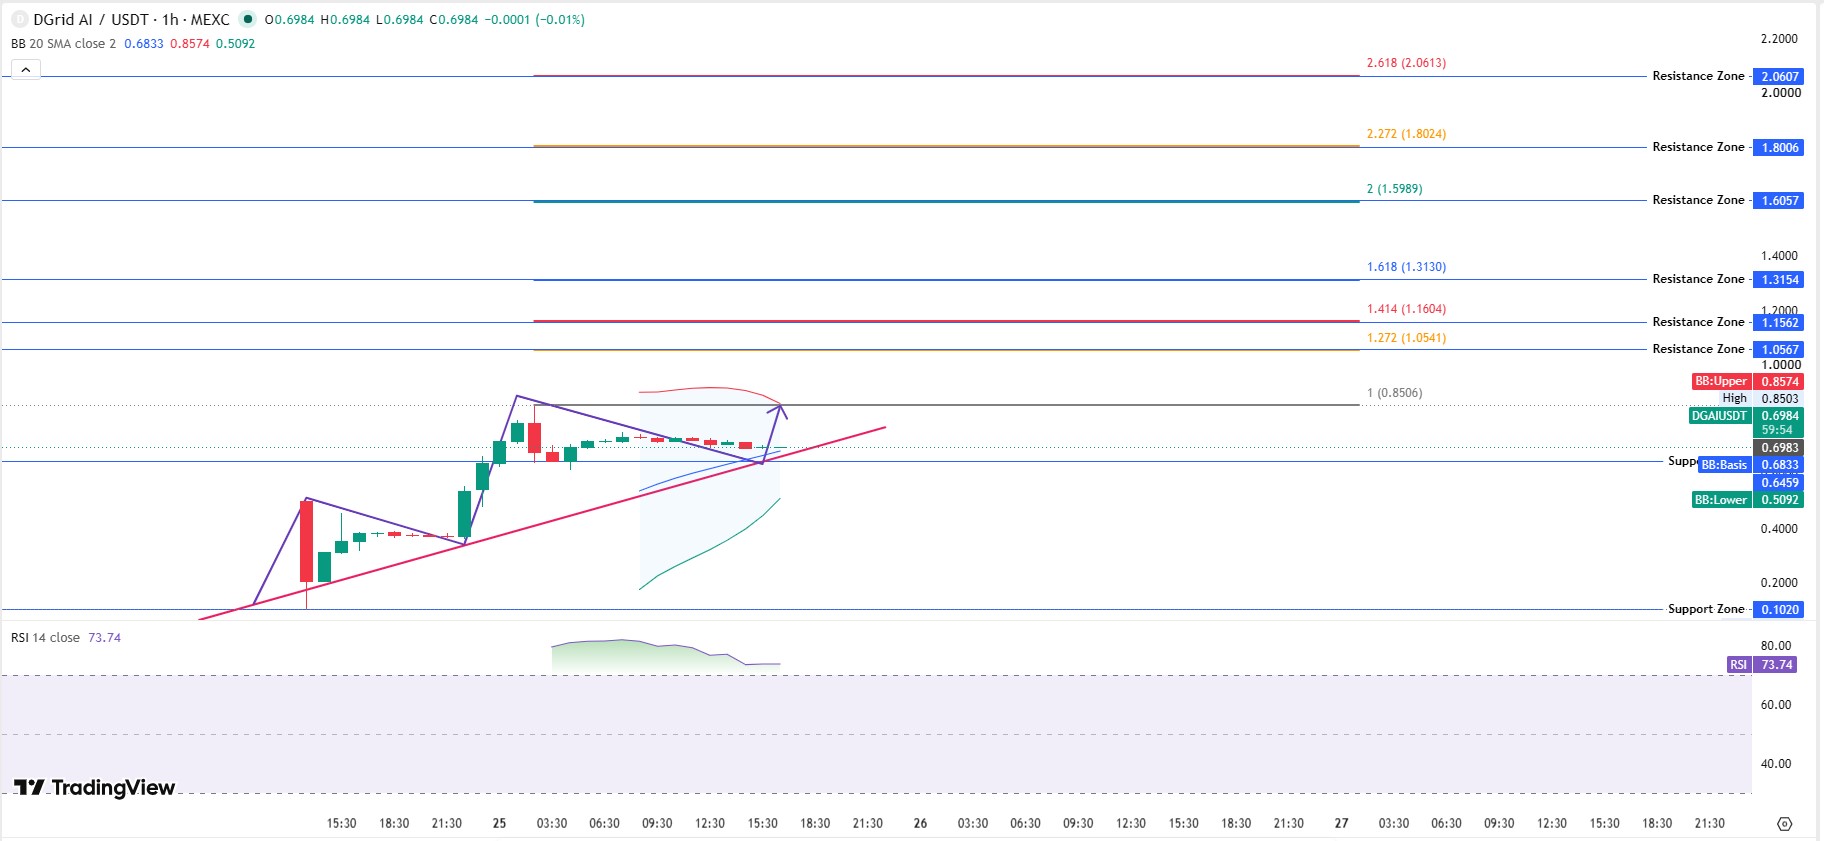
The 20-period Bollinger Band shows the basis at 0.6833, the upper band at 0.8574, and the lower band at 0.5092. That is a wide band, and price has been swinging inside it rather than settling.
RSI(14) reads 73.74, which is overbought. That does not guarantee a pullback, but momentum is stretched thin here. Fibonacci resistance zones stack at 1.0567, 1.1562, 1.3154, 1.6057, 1.8006, and 2.0607, with a support zone far below near 0.1020.
The trading structure right now looks like a market still hunting for a stable range rather than settling into one. The gap between the Bollinger basis and the upper band tells us buyers are still in control for now, but overbought conditions rarely last long without at least a short cooldown in trades.
Liquidation and Volume Snapshot
Liquidation data adds context: $9.78K liquidated over 24 hours, $9.07K from longs against $714.12 in shorts. Leveraged longs are getting caught out on every dip.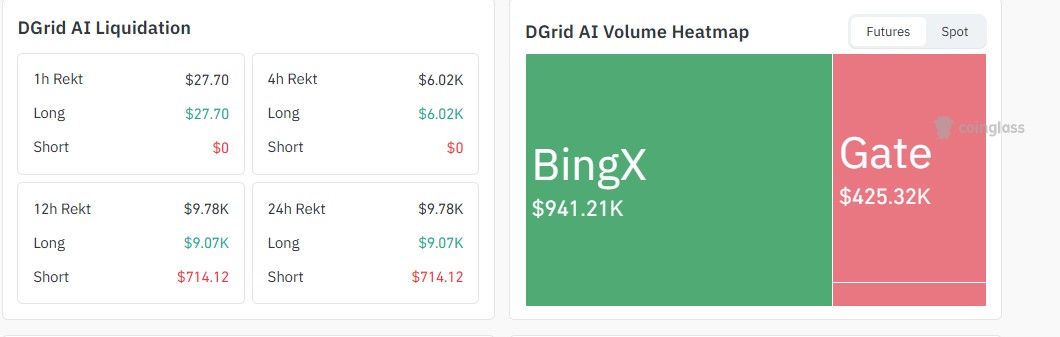
Futures volume concentrates on BingX near $941.21K and Gate near $425.32K, showing where the speculative heat is actually sitting right now.
Price Prediction: Bear, Base, and Bull Scenarios
Timeframe | Bear Case | Base Case | Bull Case | Probability | Invalidation |
7 Days | $0.42 | $0.62 | $0.86 | Bear 30% / Base 45% / Bull 25% | Loss of $0.51 support |
30 Days | $0.35 | $0.75 | $1.16 | Bear 25% / Base 40% / Bull 35% | Break below $0.36 low |
Early 2027 | $0.28 | $1.05 | $1.80 | Bear 20% / Base 40% / Bull 40% | Staking unlock selling wave |
These are scenario ranges, not guarantees. Crypto does not care about anyone's spreadsheet.
DGrid AI Tokenomics: Why Supply Timing Matters for the Forecast
$DGAI has a fixed supply of 1 billion tokens. Nodes get 50%, unlocked over 10 years with a halving every 2 years. Community Rewards take 15%, with 30% released at TGE and the rest vesting over 2 years.
Team incentives hold 10% on a 2-year vest, investors get 10% with a small immediate unlock, and airdrop allocations sit at 8%, fully unlocked at TGE. Initial liquidity takes the final 7%, also unlocked immediately.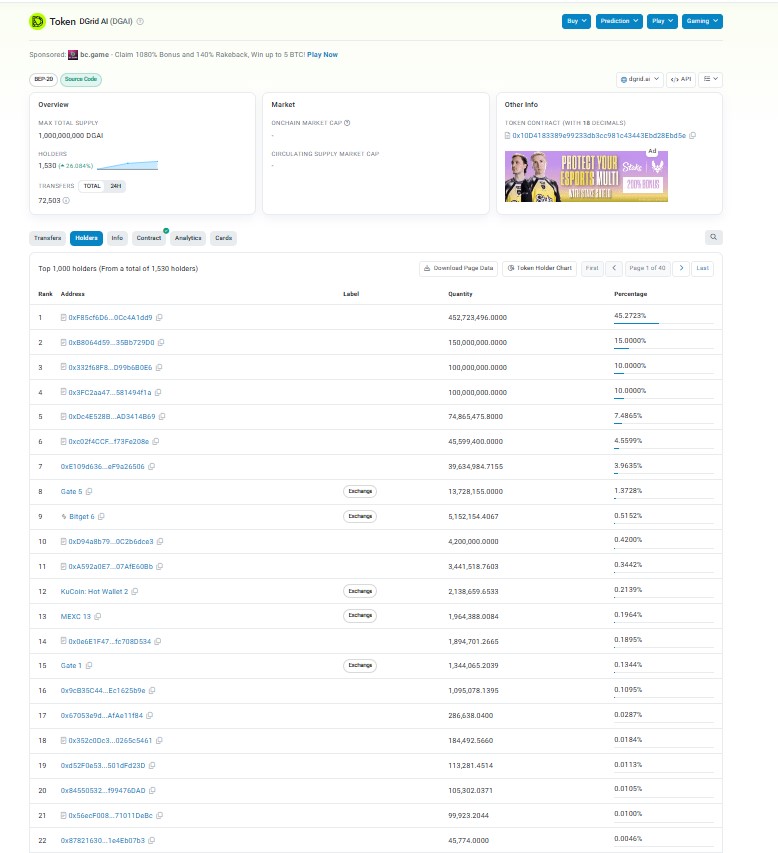
Holder concentration is worth flagging. Onchain data shows 1,530 holders, and the top wallet controls roughly 45.27% of supply, tracked through BscScan. Regulatory shifts like the MiCA regulation update are worth watching for tokens still building exchange coverage.
Altcoin and AI Token Angle: Why DGAI Fits a Bigger Narrative
DGAI is not a memecoin. It sits in the broader altcoin bucket, tied to the AI crypto category, where projects linked to model access and decentralized inference have pulled outsized attention.
DGrid positions itself as a unified access point for AI models, and premium rewards tied to usage give the token a demand loop beyond speculation. If the AI crypto news cycle stays hot, tokens like this tend to ride that wave, even as caps tracked in bitcoin market coverage move on their own schedule.
What Could Invalidate This Forecast?
A break below the $0.51 Bollinger basis on rising volume would suggest fading momentum. A sustained slide under the 24-hour low near $0.36 opens the door to a deeper base case failure.
Large unlocks landing on exchanges without matching demand could also cap upside for months. Macro risk matters too, and shifts were flagged in recent Fed meeting news.
Conclusion
Right now, DGAI looks like a token riding a genuine news cycle rather than empty hype, but overbought RSI and thin holder distribution mean the next move could go either way fast.
Anyone tracking a DGrid AI price prediction for September 2026 should watch the $0.51 support and the $1.05 resistance zone, since those two levels will likely decide which scenario plays out first. Broader price prediction coverage is worth bookmarking for updates.
Disclaimer
This article is for informational purposes only and does not constitute financial, investment, or trading advice. Cryptocurrency markets are highly volatile, and prices can change rapidly. Always do your own research and consult a licensed financial advisor before making any investment decisions. The scenarios and price levels mentioned above are estimates based on available data at the time of writing and are not guarantees of future performance.
Also read:

















