Dogecoin Price Prediction: Is A Massive Reversal Loading Up?


This Dogecoin price prediction starts with the current picture:
$DOGE is currently trading around $0.08263 today, down 0.1% over the last 24 hours.
Price is sitting below a falling trendline on the daily chart and testing a key Fibonacci retracement level, putting $DOGE at a decision point between a bounce and further downside.
Live Market Data
Metric | Value |
Price | $0.08263 |
24h Change | -0.1% |
24h Range | $0.08209 – $0.0839 |
Market Cap | $12.87B |
Fully Diluted Valuation | $14.169B |
24h Trading Volume | $468.719M |
Circulating Supply | 155.732B |
Total Supply | 155.733B |
Max Supply | ∞ (uncapped) |
Total Treasury Holding | 805,037,540 |
Source: Dogecoin market data taken from CoinGecko, data as of Sep 01, 2026. Figures may vary slightly across other tracking websites.
Exchange Volume
Dogecoin futures volume is led heavily by Binance at $344.86M, more than double the next venue. OKX follows at $164.86M, with WhiteBIT at $94.83M.
Bybit ($76.71M) and Bitget ($74.33M) sit in the next tier, followed by MEXC ($65.20M). Gate ($33.41M), Bitunix ($28.72M), BingX ($27.83M), and smaller venues including Aster ($9.53M) and KuCoin round out the rest.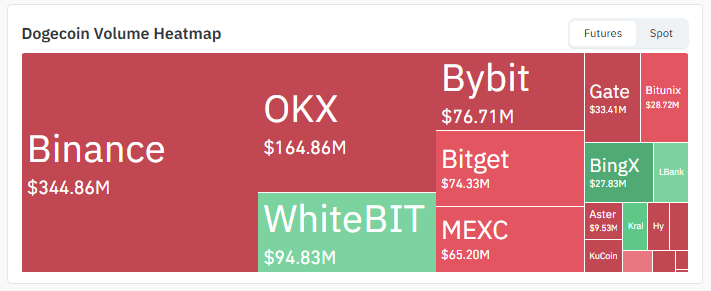
Source: Volume heatmap data taken from CoinGlass.
Volume is heavily concentrated on Binance and OKX, which together account for the majority of futures activity worth watching for outsized moves on either venue.
Liquidation Snapshot
Timeframe | Total Liquidated | Longs | Shorts |
1h | $165.76K | $165.76K | $0 |
4h | $195.07K | $173.98K | $21.09K |
12h | $297.35K | $258.79K | $38.56K |
24h | $540.33K | $362.78K | $177.55K |
Source: Liquidation data taken from CoinGlass.
Long positions have taken the bulk of the liquidation pain across every window shown here, with $362.78K in long liquidations against $177.55K in shorts over 24 hours.
That lines up with $DOGE's rejection at the falling trendline catching bullish bets off guard.
Key Takeaways
DOGE trades near $0.08263, down 0.1% over the past 24 hours, sitting below a falling trendline after a rejection from resistance.
Price is currently testing the 0.618 Fibonacci retracement level near $0.08037, with the 0.5 level ($0.08433) acting as a nearby ceiling.
A daily close back above the falling trendline, backed by volume, would open the path toward $0.09460, $0.10109, and $0.10907.
A failed bounce here would shift focus toward $0.07792 and $0.07474, the latter aligning with the 0.786 Fib level.
RSI sits at 53.75, well below its own moving average of 67.52, showing momentum has cooled sharply since the recent high.
24-hour liquidations lean heavily toward longs, with $362.78K wiped out versus $177.55K in shorts.
Technical Analysis
How Did DOGE Get Here?
DOGE rallied sharply off the 1.0 Fibonacci base near $0.06757, pushing up through the 0.786, 0.618, and 0.5 retracement levels in a fast move.
That rally ran into a falling trendline drawn from the prior swing high, and the price was rejected back down.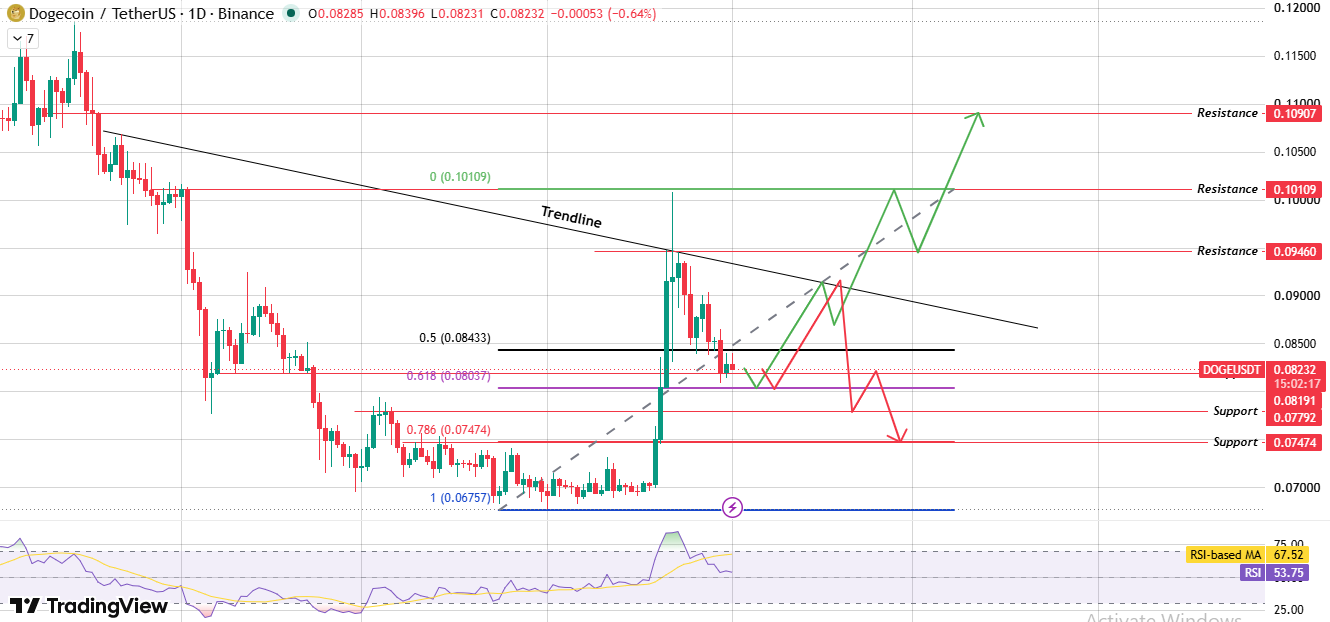
Source: Chart Taken From TradingView.
Since that rejection, DOGE has pulled back and is now testing support and the 0.618 Fib level around $0.08037.
What Pattern Is DOGE Forming Now?
Price is currently trading below the falling trendline, inside a zone bounded by the 0.5 and 0.618 Fibonacci retracement levels.
This is a classic pullback-to-support setup: whether DOGE holds here and bounces, or breaks down further, will decide the next multi-week direction.
Is Momentum Still Supportive?
RSI reads 53.75 today, sitting well below its own moving average of 67.52. That wide gap shows momentum has faded significantly since the rally peaked.
The reading is still just above the neutral 50 mark, so the setup isn't outright bearish yet, but the cooling trend favors caution until DOGE reclaims the falling trendline.
What Happens On A Bounce And Trendline Break?
If $DOGE holds current support and bounces with rising volume, breaking back above the falling trendline would confirm a resumption of the uptrend.
That scenario points first toward $0.09460, then $0.10109, with $0.10907 as the extended target.
What Happens If the Bounce Fails?
If $DOGE instead fails to sustain a bounce here and breaks down through the 0.618 Fib level, that would confirm continued weakness.
The first support to watch in that case is $0.07792, followed by $0.07474, a level that also aligns with the deeper 0.786 Fibonacci retracement.
Support & Resistance Levels
Type | Level |
Resistance 3 | $0.10907 |
Resistance 2 | $0.10109 |
Resistance 1 | $0.09460 |
Support 1 | $0.07792 |
Support 2 | $0.07474 |
Bull, Base & Bear Case
Scenario | Target Levels | Trigger | Invalidation |
Bull Case | $0.09460 $0.10109 $0.10907 | Daily close above the falling trendline with volume above the recent daily average | Daily close back below the 0.618 Fib level |
Base Case | $0.07792 – $0.08433 range | Price holds between support and the falling trendline, oscillating around the 0.618 Fib level. | Break of either boundary on a daily close |
Bear Case | $0.07792 $0.07474 | Daily close below current support and the 0.618 Fib level | Daily close back above the falling trendline |
Note: All levels are chart-derived from the daily DOGE/USDT timeframe. This is not financial advice, and any bounce or breakdown signal can fail; treat these as conditional scenarios, not guarantees.
Glossary
Falling Trendline: A line connecting a series of lower highs, used to gauge whether a rally has run into overhead selling pressure.
Fibonacci Retracement: A tool that marks likely support/resistance levels (such as 0.5, 0.618, and 0.786) based on how far the price has pulled back from a prior move.
RSI (Relative Strength Index): An oscillator ranging from 0 to 100 that measures the speed and size of recent price moves, often used to flag overbought or oversold conditions.
Liquidation: The forced closing of a leveraged position when losses erode a trader's margin below the required maintenance level.
Treasury Holding: Tokens held by a project's or foundation's treasury rather than circulating on the open market.
Methodology
Price levels and chart patterns referenced in this Dogecoin price prediction are drawn from the DOGE/USDT daily chart on Binance, using the most recent completed daily candle close.
Liquidation and exchange volume figures are sourced from a derivatives dashboard
All levels reflect data at the time of writing and are subject to change as new candles form.
This forecast does not extend any target beyond what the visible chart structure directly supports.
Disclaimer: This Dogecoin price prediction is for informational purposes only and does not constitute financial, investment, or trading advice. DOGE and cryptocurrency markets broadly are highly volatile, and any chart pattern discussed here, including the trendline and Fibonacci levels, can fail to play out as expected. Downside risk in the bear scenario could extend beyond the stated support levels if broader market conditions turn negative. Always do your own research and consult a qualified financial advisor before making investment decisions.
Also read:
















