Ethena Price Prediction: What to Expect Next For $ENA?


Ethena's ENA token walked into the last week of August like it had something to prove.
After months of grinding sideways, the token broke loose, pulling in fresh volume and turning heads across trading desks.
This Ethena Price Prediction looks at what's fueling the move, how traders are positioned, and what the charts hint at next, without telling anyone what to do about it.
ENA's Big Week: Market Snapshot
Any solid Ethena price prediction starts with the basics. ENA price today stands near $0.1532, up 7.36% over the last 24 hours, as per CoinMarketCap data.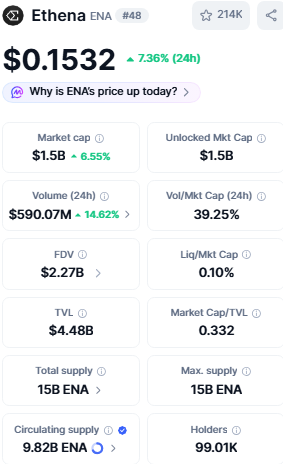
Its market cap has climbed to roughly $1.5 billion, while 24-hour trading volume touched $590.07 million, a 14.62% jump that points to fresh capital entering the market.
Ethena's fully diluted valuation sits at $2.27 billion, and the protocol's total value locked is reported at $4.48 billion.
Out of a 15 billion max supply, 9.82 billion ENA tokens are already circulating across more than 99,000 wallet addresses.
Whales, Sharks, and Shrimps: Who Really Holds ENA?
Ownership remains tightly concentrated. The top 100 wallets hold close to 90% of circulating supply, and whale addresses, just 0.42% of all holders, account for nearly 98% of total market cap.
On-chain holder data for the ENA token reflects this concentration directly.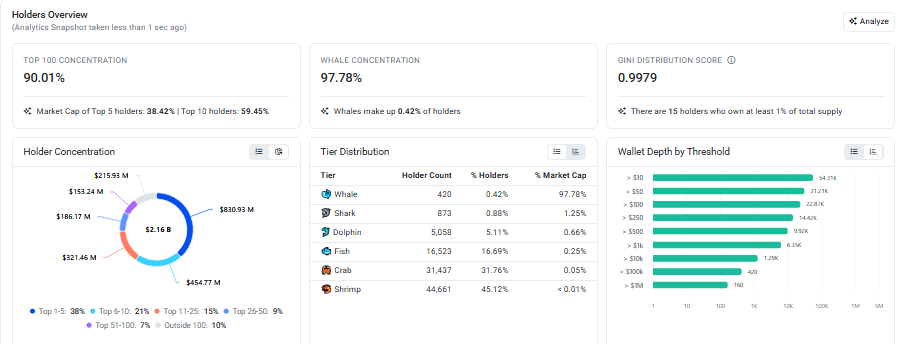
That kind of concentration means a handful of large wallets can move the market faster than broad retail activity ever could.
Money Flow: Performance and Trader Positioning
Derivatives data adds useful context to this Ethena price prediction. According to CoinGlass data, open interest has risen to around $406.67 million, up sharply from the $200 million range seen earlier in August, while long/short ratios on Binance and OKX both lean toward longs, with top trader ratios above 1.7.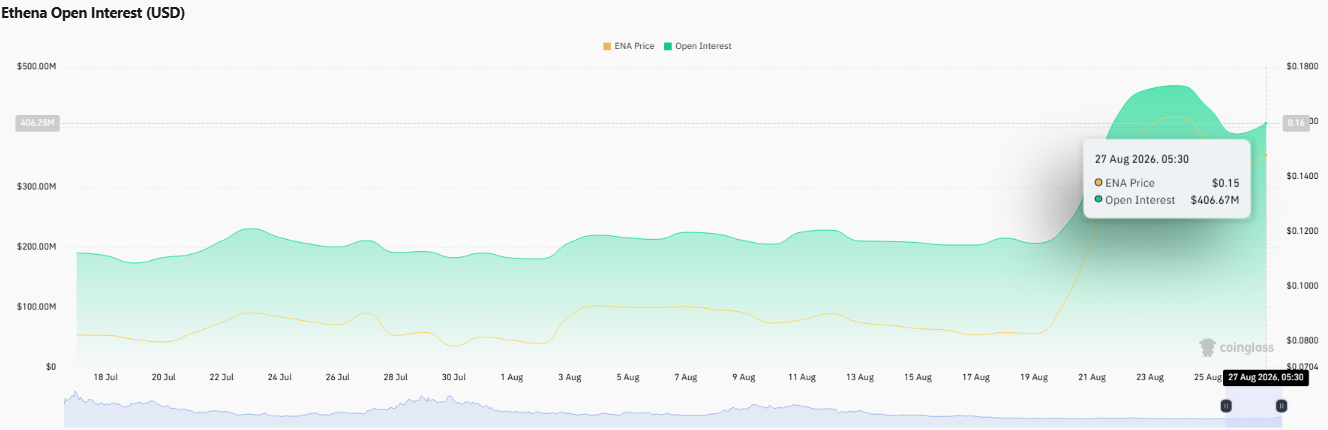
ENA is up 61.17% over the past seven days, 83.50% over 30 days, and 70.81% over 90 days, though it remains down 24.54% year-to-date and 76.05% over the past year, a reminder of how deep the earlier drawdown was.
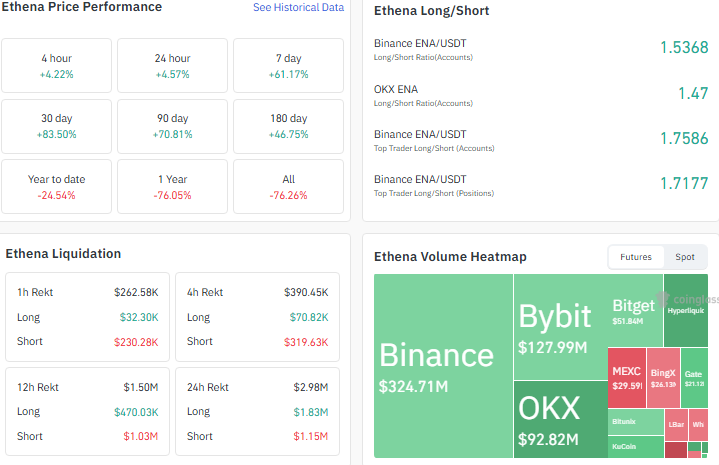
Liquidation data shows a mixed picture: roughly $2.98 million in positions were wiped out over 24 hours, with longs making up $1.83 million of that, suggesting some late buyers got caught in the swings.
Binance continues to lead ENA's derivatives volume at over $324 million, followed by Bybit and OKX.
Bulls vs Bears: Where Sentiment Stands
These mixed signals are exactly why any Ethena price prediction right now needs to weigh momentum against risk rather than lean on one side alone.
Signal | Observation |
Bullish | A seven-day rally of over 60%, rising open interest, long/short ratios favouring longs |
Bearish | Overbought RSI, elevated long liquidations in the last 24 hours, deep negative yearly performance |
Neutral | Extremely high whale concentration, price still far from prior highs |
Chart Check: Momentum, Levels, and RSI
As per the TradingView chart, ENA broke out of a multi-month ascending channel in late August and has been holding above its first major resistance zone since.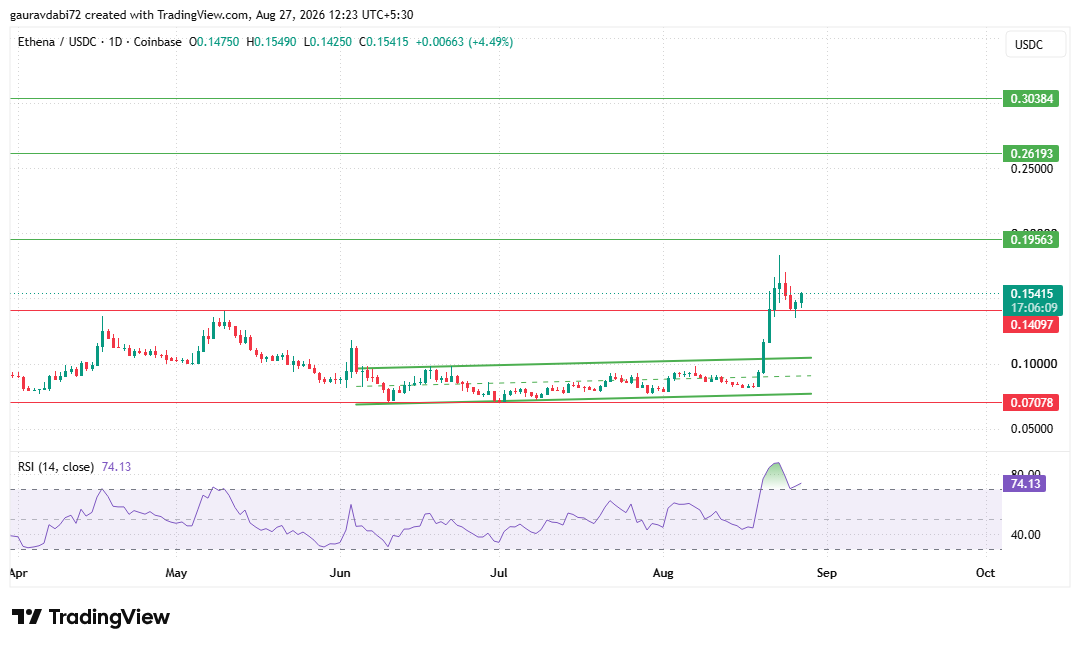
If this momentum continues, the next levels ENA can go toward are 0.19563, followed by 0.26193 and 0.30384.
On the downside, near-term support sits around 0.14097, with a deeper cushion at 0.07078 should selling pressure return.
The Relative Strength Index is currently reading 74.13, firmly in overbought territory, which suggests this ENA price forecast has been sharp and volume-backed but may need to cool off before any fresh push higher.
This Ethena price prediction will keep tracking how the price behaves around these zones in the sessions ahead.
Analyst View
As per the CoinGabbar analyst desk, ENA's structure stays constructive as long as price holds above the 0.14097 support zone, with the recent breakout and rising open interest pointing to possible continuation toward higher levels.
An overbought RSI and heavy long liquidations in the past 24 hours, however, signal the move is stretched, and a slip back below support would weaken this setup.
Disclaimer: This article is for informational purposes only and does not constitute financial, investment, or trading advice. Cryptocurrency markets are highly volatile and unpredictable; readers should conduct their own research before making any decisions. CoinGabbar and the author bear no responsibility for losses incurred based on this content.

















