Ethena Price Prediction September 2026: ENA Eyes $0.50


This Ethena price prediction September 2026 arrives right after one of the sharper moves this chart has produced in months.
A downtrend that had been grinding lower for the better part of a year suddenly snapped, and price nearly doubled in the weeks that followed.
Now that explosive move is cooling off, and the chart is asking a simple but important question: was that a real trend change, or just a violent bounce inside a bigger decline? Here's the full picture.
ENA Price Today: Live Data and 24-Hour Change
Price is trading near $0.14268 on the weekly chart.
Separate live data from CoinGlass puts the coin around $0.14338, down close to 4.48% over the past 24 hours, with futures volume of $666.41 million against spot volume of $81.28 million and open interest at $392.75 million.
Market cap stands at $1.40 billion on a circulating supply of 9.82 billion ENA against a total and max supply of 15 billion tokens, meaning roughly 5.18 billion tokens, close to 34.5% of the eventual max supply, remain outside circulation.
Source: TradingView (ENA/USDT perpetual, Binance, weekly chart) and CoinGlass, both accessed August 25, 2026, IST.
ENA Liquidation Data Today
Short-side liquidations have dominated across every measured window, a pattern consistent with a market still working off the recent breakout squeeze.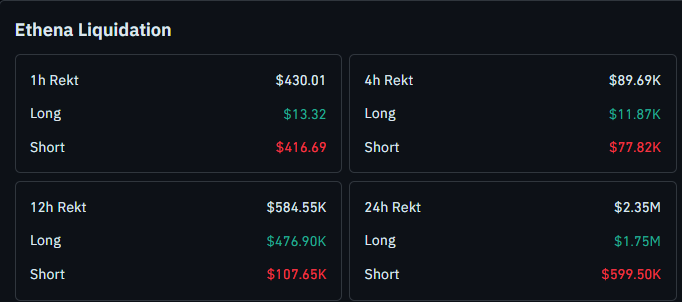
Over 24 hours, short-side liquidations totaled $599.50K against $1.75M on the long side, and over 12 hours it was $107.65K short-side versus $476.90K long-side, showing the mix shifting more recently as the pullback pressures leveraged longs.
Zooming into the shortest windows tells a different story.
Over 4 hours, short-side liquidations of $77.82K outweighed the $11.87K on the long side, and over 1 hour it was $416.69 short-side against just $13.32 long-side.
Suggesting the immediate price action has been squeezing short positions even as the broader 24-hour and 12-hour data show longs taking the bigger hit overall.
Source: CoinGlass liquidation data, August 25, 2026.
Quick Take
CMP: $0.14268
Weekly trigger: sustain above $0.14020, open $0.19043, then $0.30236
Weekly failure: close below $0.07695 invalidates the bullish structure
Data as of August 25, 2026, IST
Short risk note: these levels come from the weekly chart and depend on confirmed weekly closes, not intraday wicks.
Leveraged positions around these zones carry liquidation risk if price whipsaws before a level is confirmed.
Ethena Technical Forecast September 2026
ENA spent the better part of a year sliding lower along a well-defined descending trendline, the kind of grinding downtrend that tends to wear out both bulls and bears before it finally resolves.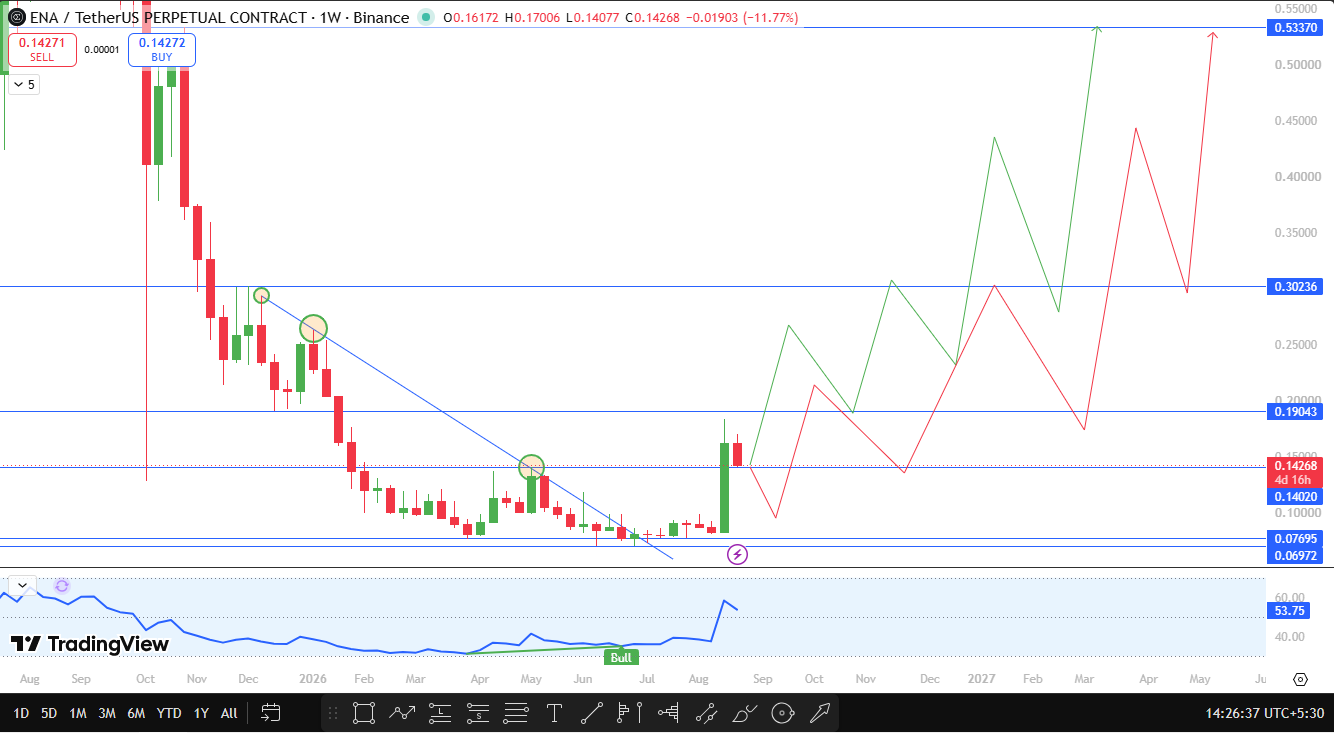
That resolution came recently in dramatic fashion.
Price broke out of the trendline and rallied close to 100% in a short stretch, a move sharp enough to catch a lot of leveraged shorts off guard, which lines up with the liquidation data showing short positions taking the bigger hit during the fastest part of the move.
That kind of vertical move rarely continues in a straight line, and ENA is now giving back some of those gains in a pullback.
The key question for this Ethena price outlook September 2026 is whether the price can hold above $0.14020. If it does, the breakout structure stays intact even with a deeper pullback still possible along the way.
The chart's momentum indicator recently spiked to a reading near 53.75 with a bull tag showing, reflecting the strength of the initial breakout even as price cools off from its highs.
If ENA sustains above $0.14020, roughly 1.74% below current price, it keeps the path open toward $0.19043 as the next resistance, a level around 33.47% above current price.
Beyond that, $0.30236 stands out as the next major swing high, sitting close to 111.92% higher, with $0.53370 marked as the major resistance further out, representing a move of roughly 274.06% from current levels if this ENA breakout prediction in September 2026 plays out toward its full potential.
On the downside, a weekly close below $0.07695, about 46.07% under current price, would invalidate this bullish outlook entirely, suggesting the recent breakout was a temporary spike rather than a genuine trend reversal, with $0.06972 as the next level to watch if that support fails too.
Source: TradingView, ENA/USDT perpetual chart, 1-week timeframe, Binance, captured August 25, 2026, IST.
ENA Support and Resistance Levels to Watch
Level Type | Price | Change from CMP | Note |
Support | $0.06972 | -51.14% | Deeper swing low if the invalidation level fails |
Support | $0.07695 | -46.07% | Weekly close below this invalidates the bullish setup. |
Support | $0.14020 | -1.74% | Key level: sustaining above this keeps the breakout structure intact. |
Resistance | $0.19043 | +33.47% | First target if $0.14020 holds |
Resistance | $0.30236 | +111.92% | Major swing high, second target |
Resistance | $0.53370 | +274.06% | Major resistance |
ENA Price Prediction: Bull, Base, and Bear Cases
The base case has ENA working through its current pullback through much of September, holding somewhere between $0.14020 and $0.19043 without a decisive move toward either extreme.
The bull case activates if ENA sustains above $0.14020, which keeps the door open toward $0.19043 and eventually the $0.30236 and $0.53370 levels further out.
This ENA technical analysis September 2026 case leans on the strength of the initial breakout, which was significant enough to nearly double the price and squeeze a meaningful amount of short-side leverage in the process.
The bear case needs a weekly close below $0.07695, which would suggest the entire breakout move was a sharp but temporary spike rather than a lasting shift in trend, with a deeper decline toward $0.06972 in focus if that happens.
Every one of these ENA price target September 2026 scenarios depends on a confirmed weekly close, not a temporary wick through any level.
September 2026 Catalysts
Whether ENA can stabilize above $0.14020 after this pullback is the most immediate technical catalyst traders will be watching through early September.
Beyond that, developments around Ethena's USDe supply growth and yield mechanics, along with broader shifts in Bitcoin dominance and overall crypto market liquidity, could meaningfully influence whether the breakout structure holds through the month.
Risks That Could Invalidate This Forecast
This bullish outlook fails if ENA cannot hold above $0.14020 and fails more seriously if the price closes below $0.07695, which would suggest the sharp breakout rally was a temporary squeeze rather than a genuine trend reversal.
Broader risks include a sudden shift in demand for USDe and Ethena's yield product, shifts in Bitcoin dominance, macro liquidity conditions, and general crypto market volatility, any of which could override ENA's own chart structure regardless of where its levels sit.
Glossary
Descending trendline: a downward-sloping line connecting a series of lower highs, used to track a prevailing downtrend
Trendline breakout: a move where price closes beyond a trendline that had previously acted as resistance or support
Weekly close: the final traded price when a weekly candle finishes, used to confirm whether a breakout or breakdown is genuine
Open interest: the total number of outstanding futures or options contracts that have not yet been settled
Support: a price zone where buying pressure has previously stepped in
Resistance: a price zone where selling pressure has previously capped upside
Invalidation level: the price point at which a forecast scenario is considered incorrect
Synthetic dollar: a stablecoin-like asset, such as Ethena's USDe, backed by a delta-neutral hedging strategy rather than direct cash reserves
Disclaimer
This article is for informational purposes only and does not constitute financial advice. Cryptocurrency markets are highly volatile, and all price levels discussed are based on technical chart analysis, not a guarantee of future performance. Readers should conduct their own research before making any investment decisions.

















