Bitcoin Rally Fuels Ethena Price Prediction: $ENA Eyes 5X Target Soon?


Bitcoin is trading near $75,077.53 after an 8% up in 24 hours, strengthening the broader crypto market.
If BTC sustains this momentum, Etheena could benefit from stronger buying interest and potentially deliver a stronger percentage move.
Ethena just had one of its loudest days in months. ENA is up 35% today, trading near $0.1245, and Arthur Hayes has crypto Twitter buzzing after calling a 5 bagger on $ENA too easy.
This Ethena Price Prediction looks at whether the excitement can hold or whether this turns into another sharp pump that fades fast, using the latest price action, liquidation data, and the Hayes tweet as a backdrop.
Market data was checked on August 21, 2026, at 09:40 IST.
Ethena Price Prediction Today: Market Overview
Metric | Value |
Price | $0.12428 |
24h Change | +35.11% |
Market Cap | $1.22B |
Unlocked Market Cap | $1.22B |
24h Change (Market Cap) | +35.29% |
24h Volume | $473M+ |
24h Change (Volume) | +180.33% |
Vol/Mkt Cap (24h) | 37.83% |
FDV | $1.86B |
Liq/Mkt Cap | 0.14% |
TVL | $4.38B |
Market Cap/TVL | 0.2795 |
Total Supply | 15B ENA |
Max Supply | 15B ENA |
Circulating Supply | 9.82B ENA |
Holders | 99.34K |
Source: Data from CoinMarketCap as of August 21, 2026, at 09:45 IST. Figures may vary slightly across other tracking websites.
Arthur Hayes ENA Tweet: What It Means
BitMEX co-founder Arthur Hayes posted a chart of ENAs long decline followed by its recent bounce and said a 5x move looked too easy. 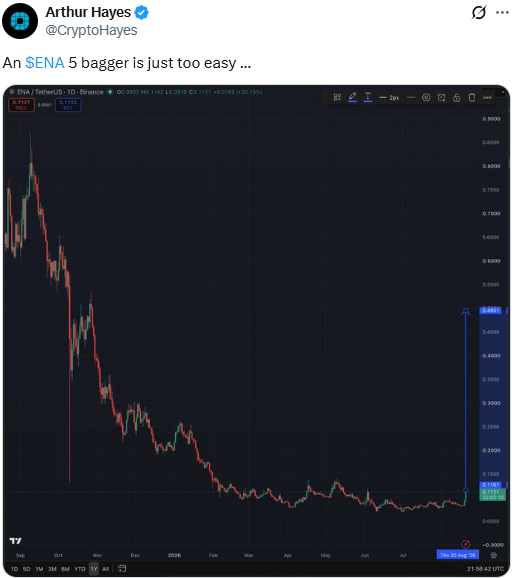
Source: Data From X
Note: This is a personal opinion from a well-known trader, not a verified price target, and CoinGabbar could not independently confirm the reasoning behind it.
Ethena Liquidation and Volume Data
Liquidations (Coinglass, Futures)
Timeframe | Total | Long | Short |
1h | $361.32K | $130.32K | $231.00K |
4h | $1.18M | $278.70K | $905.11K |
12h | $2.49M | $352.74K | $2.14M |
24h | $3.36M | $404.84K | $2.96M |
Exchange Volume (Futures)
Exchange | Volume |
Binance | $401.26M |
Bybit | $142.77M |
Short liquidations have outpaced longs across every window, especially the 12h and 24h windows, pointing to a short squeeze feeding part of this rally.
ENA Price Prediction Chart: Technical Analysis
Pair: ENA/USDT · Market: Spot (Crypto) · Exchange: OKX · Timeframe: 1D · Source: TradingView · Timestamp: August 21, 2026, 09:40 UTC+5:30
ENA closed at $0.12428, breaking above a long descending trendline that had capped every rally since late last year.
The breakout has been confirmed, and the price is now trading above the current support level.
If this support holds, it could provide a strong base for further upside and keep the bullish momentum intact.
RSI (14) sits at 79.91, an overbought reading that shows the move has been fast.
Price is holding just above a marked support at $0.11650, with a deeper support level below at $0.09876, and the next marked resistance sitting well above at $0.13933.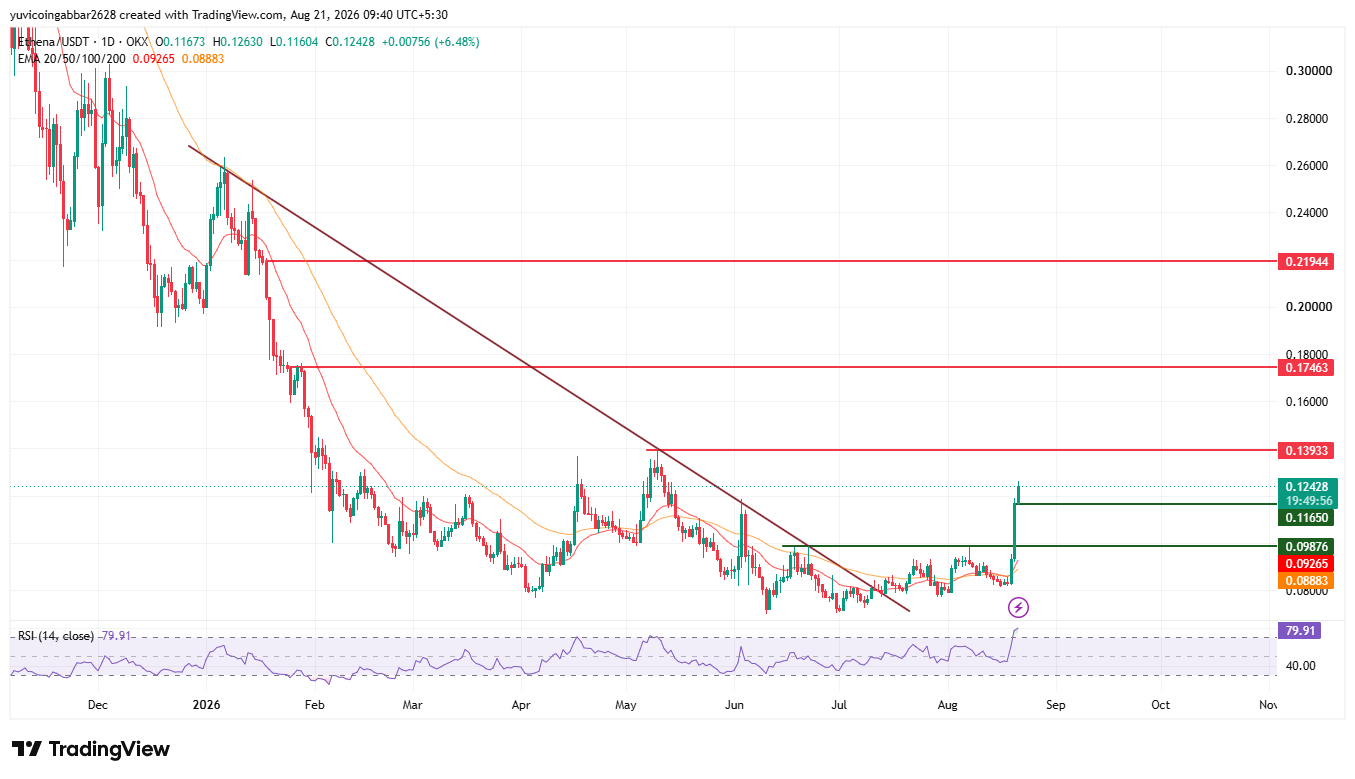
Important Support and Resistance Levels
Level Type | Price |
Resistance 3 | $0.21944 |
Resistance 2 | $0.17463 |
Resistance 1 (nearest) | $0.13933 |
Immediate Price Reference | $0.12428 |
Nearest Support | $0.11650 |
Deeper Support | $0.09876 |
Ethena Forecast 2026: Bull Case vs. Bear Case
ENA price target 2026 Bull case: Closing above the descending trendline is a shift after months of lower highs.
Holding above $0.11650 keeps the breakout structure intact, and a close above $0.13933 would open the door toward $0.17463, with a further price level of $0.21944 into 2026.
ENA price target 2026 Bear case: RSI near 80 signals the bounce is stretched, and a cooldown toward $0.11650 or the trendline zone would not be unusual.
Losing $0.11650 would put the breakout back in doubt, and a deeper slide could further expose $0.09876 as the next downside level.
Price Scenarios 2026: Triggers and Invalidation
Scenario | Trigger | Likely Outcome | Invalidation Point |
Trendline hold | Price stays above trendline and $0.11650 | Continuation toward $0.13933 | Close below $0.11650 |
Resistance breakout | Close above $0.13933 | Move toward $0.17463 | Rejection back below $0.12428 |
Pullback | RSI cools from 79.91 | Retest of $0.11650, deeper test of $0.09876 | Break below $0.09876 |
Can ENA Reach $0.21944?
$0.21944 is the highest resistance marked on the chart.
Getting there would require ENA to first clear $0.13933, then $0.17463, a multi-stage climb rather than a single move.
Ethena Price Prediction: Expert View
According to CoinGabbar analysts, ENA broke a months-long downtrend on a day marked by heavy short liquidations, and the Hayes tweet has added fuel to an already sharp move.
RSI near 80 means the rally is extended, so some cooling is normal rather than a warning sign on its own.
Volume backing this breakout is well above recent averages, which supports the move having real participation behind it.
The $0.11650 zone is the level that matters most right now for whether this breakout sticks.=
Disclaimer
This piece is for informational purposes only and is not financial advice. The levels and scenarios above are based on technical chart analysis and publicly available data at the time of writing. Crypto markets can move sharply within hours, so past patterns do not guarantee future outcomes. It is worth doing independent research and considering your own risk tolerance before acting on any of the levels discussed here.










.webp)






