Ethereum Whale Moves $253M to Exchanges: What's Next for ETH Price?


Ethereum is trading around $2,392, down about 2.11% over the past day. The pullback comes after a strong August rally that pushed ETH close to $2,550.
A mix of whale selling, cooling ETF inflows, and a stronger US dollar is putting pressure on the price right now.
What is Ethereum's price today?
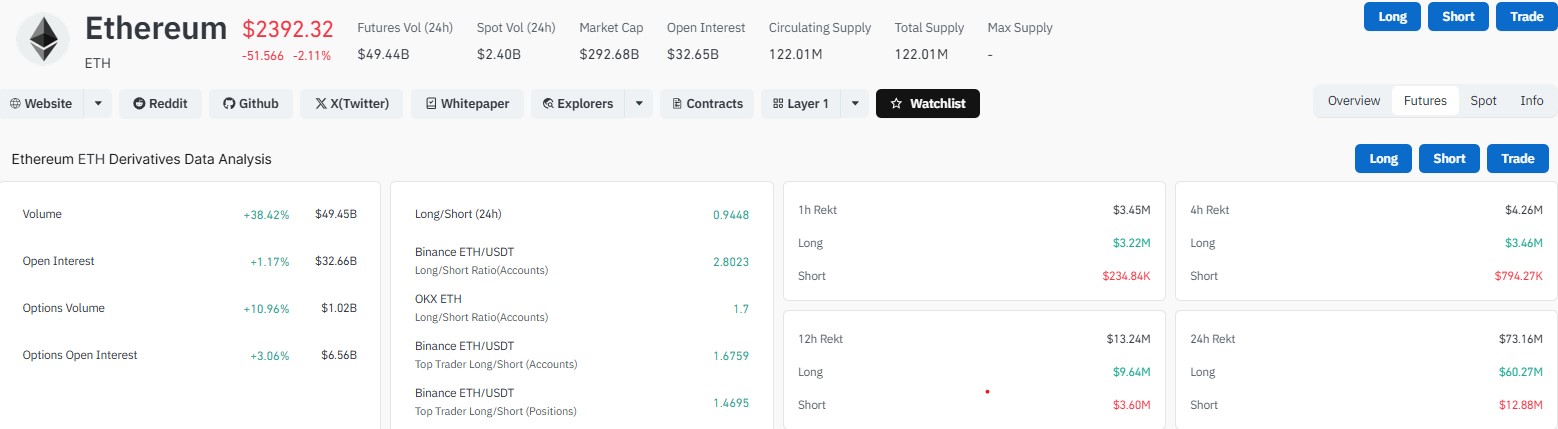
At the time of writing, ETH sits near $2,392.32. Its 24-hour trading volume is close to $49.44 billion, and open interest in futures markets stands at roughly $32.65 billion.
The 24-hour spot volume is around $2.40 billion, and Ethereum's market cap is close to $292.68 billion.
Metric | Value |
ETH Price | $2,392.32 |
24h Change | -2.11% |
Futures Volume (24h) | $49.44B |
Open Interest | $32.65B |
Market Cap | $292.68B |
Long/Short Ratio | 0.9448 |
Why is Ethereum price dropping today?
Several forces are pulling ETH lower this week.
US Treasury yields have climbed, and the dollar has firmed up. That combo usually cools demand for riskier assets like crypto.
Traders are also pricing in a chance that the Federal Reserve stays hawkish for longer, given firming energy prices and inflation worries.
On top of that, a large Ethereum whale has been dumping coins. According to on-chain tracker Lookonchain, this wallet moved a total of 103,252 ETH (worth about $253 million) into multiple exchanges over the past three days. The wallet still holds 64,603 ETH, worth close to $155.8 million.
Large deposits like this often raise concerns about extra selling pressure hitting the order books.
Are Ethereum ETF inflows still positive?
Yes, but they have slowed down.
As per SoSoValue data, US spot Ethereum ETFs saw net inflows of about $10.95 million on September 1. That marks 12 straight days of net inflows, but the daily pace has clearly cooled from the aggressive streak seen in late August.
The Coinbase Premium Index has also turned slightly negative, which suggests US institutional buying has paused for now.
What do the charts say about ETH right now?
On the 4-hour chart, Ethereum is trading between roughly $2,380 and $2,420. The price has slipped below both the 20 EMA (around $2,440) and the 50 EMA (around $2,429).
The RSI reading is close to 33, which points to weak momentum. It isn't deeply oversold yet, but it's getting closer to that zone.
Zooming out, the 100 EMA sits near $2,342, and the 200 EMA is close to $2,197 on the 4-hour chart. Both are still trailing well below the current price, which tells us the broader uptrend from the August breakout hasn't actually broken down yet.
ETH has been repeatedly rejected near the $2,500 to $2,550 zone, which now looks like a solid resistance area on the chart.
A separate signal worth noting is the daily chart, where some analysts point to a golden crossover forming.
Historically, this pattern has sometimes lined up with the early stages of longer bull runs, though it doesn't guarantee that outcome every time.
What is the key support level for Ethereum?
The $2,380 zone is the level most traders are watching closely.
If that support breaks on a clean 4-hour close, ETH could slide toward $2,340, and possibly $2,300 to $2,200 after that.
Ethereum is also approaching its 50-week EMA. Holding above this longer-term average could open the door to a move back toward $2,500 to $2,550.
What happens if Ethereum holds $2,380 support?
If buyers step in and reclaim the $2,430 to $2,450 zone, a relief move toward $2,500 becomes more likely, with $2,550 marking the bigger breakout level.
A sustained break above $2,550 could open the path toward the $2,700 to $2,800 range over time.
Liquidations show pressure on long positions
Liquidation data adds more context to the current mood.
Over the past 24 hours, total liquidations reached about $73.16 million. Of that, $60.27 million came from long positions, while only $12.88 million came from shorts.
The pain has been building over several windows, not just today. Here's how it breaks down:
Timeframe | Long Liquidations | Short Liquidations |
1 hour | $3.22M | $234.84K |
4 hours | $3.46M | $794.27K |
12 hours | $9.64M | $3.60M |
24 hours | $60.27M | $12.88M |
That imbalance shows leveraged buyers have been squeezed the hardest during this pullback. The long/short ratio of 0.9448 also points to slightly more short positioning across the market right now.
Ethereum price prediction: bullish or bearish near term?
The near-term bias leans bearish while ETH trades below $2,430. The $2,380 level is the key line in the sand for now.
A move above $2,450 would shift the setup toward a more bullish tone. A drop below $2,380 raises the odds of a slide toward $2,300 and lower.
None of this is guaranteed. Ethereum's next move will likely depend on how ETF flows hold up, what the whale wallet does next, and how Treasury yields behave heading into upcoming Fed commentary.
Disclaimer
This article is for informational purposes only and does not constitute financial, investment, or trading advice. Cryptocurrency markets are highly volatile and carry significant risk, including the potential loss of principal. Prices mentioned are subject to change rapidly. Always do your own research before making investment decisions.
















