Dogwifhat Price Prediction: $WIF Setup Looks Ready to Explode


Dogwifhat launched in late 2023 as a Solana-based meme coin built around a viral image of a dog wearing a pink knitted hat.
It had no real utility beyond the joke, but that didn't stop it from becoming one of the standout meme coins of its cycle, riding pure community momentum and social virality to a multi-billion dollar valuation at its peak.
Anyone searching for a Dogwifhat price prediction today will find $WIF trading around $0.1948, up 0.3% over the last 24 hours.
Its market capitalization sits close to $194.601 million on a circulating supply just under 998.926 million tokens.
Live Market Data
Metric | Value |
Price | $0.1948 |
24h Change | +0.3% |
Market Cap | $194.601M |
Fully Diluted Valuation | $194.601M |
24h Trading Volume | $59.978M |
Circulating Supply | 998.926M |
Total Supply | 998.926M |
Max Supply | 998.926M |
24h Range | $0.1905 – $0.2031 |
Exchange Volume
Exchange | 24h Volume |
Binance | $25.93M |
Bybit | $11.48M |
WhiteBIT | $8.52M |
OKX | $6.95M |
KuCoin | $5.95M |
BingX | $5.82M |
MEXC | $3.69M |
Bitget | $3.21M |
Bitunix | $2.16M |
Hyperliquid | $2.69M |
Gate | $1.84M |
Source: Volume Heatmap Data Taken From CoinGlass, As of Sep 02, 2026
Futures activity is heavily concentrated on Binance and Bybit, which together account for a large share of tracked volume.
That weighting suggests leveraged traders are actively positioning around the current retest of the breakout zone.
Liquidation Snapshot
Window | Total | Long | Short |
4h | $2.54K | $1.20K | $1.34K |
12h | $55.21K | $37.79K | $17.42K |
24h | $131.30K | $101.55K | $29.76K |
Source: Liquidation Data Taken From CoinGlass, As of Sep 02, 2026
Longs account for the bulk of liquidations across every window
That pattern lines up with a market that rallied hard first and is now shaking out over-leveraged buyers during the pullback into the retest zone, rather than one already flushed and settled.
Key Takeaways
WIF trades near $0.1948, up 0.3% in the past day, after breaking above a long-running descending channel on the daily chart with a sharp rally.
Price has since pulled back and is now retesting the breakout zone, sitting right around a fair value gap left behind during the rally.
A bounce from this zone keeps resistance at $0.2566, $0.3148, and $0.3684 in play.
A failed retest could send the price back down toward support at $0.1862, $0.1580, and $0.1328.
Long liquidations dominate every timeframe tracked, from 1h through 24h, pointing to leveraged buyers getting shaken out during the pullback.
Technical Analysis of Dogwifhat Price
A Descending Channel Breaks, Then Price Comes Back to Retest It
The daily WIF/USDT chart on Binance shows the price spending an extended stretch inside a descending channel, grinding lower in a well-defined downtrend.
That changed with a sharp move that broke clean above the channel's upper boundary, pushing WIF up fast before momentum cooled off.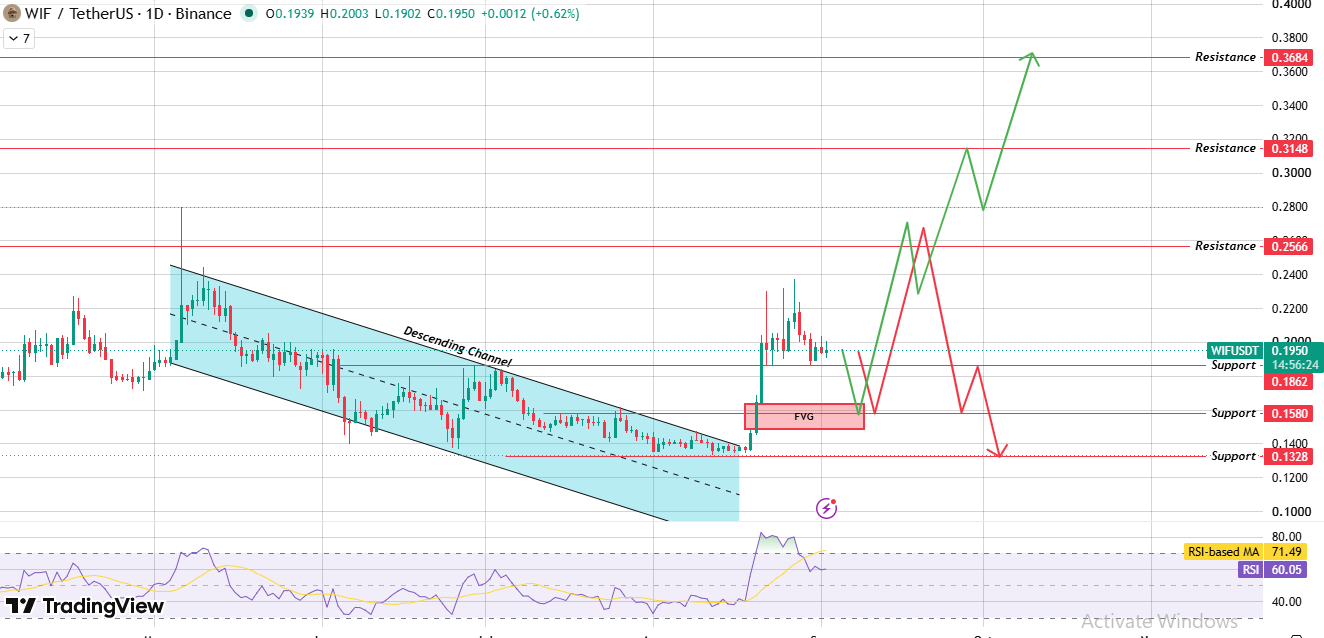
Source: Chart Taken From TradingView, As of Sep 2, 2026
Since that breakout, price has pulled back and is now sitting right at the retest zone, an area that also lines up with a fair value gap (FVG) left behind during the rally. This is the spot the market is deciding on right now.
If $WIF finds support here and the FVG fills without price breaking down further, a bounce could carry it back up toward resistance at $0.2566. Clearing that opens the door to $0.3148 and then $0.3684 above.
If the bounce fails to hold and the price can't sustain itself at this zone, WIF risks slipping toward lower support levels at $0.1862, then $0.1580, with $0.1328 as the next cushion below.
Momentum Reading Leans Warm, Not Overheated
RSI on the daily chart currently sits at 60.05, with the RSI-based moving average running higher at 71.49.
That gap between the two suggests momentum has cooled slightly from its hottest point during the breakout rally, even though the broader reading still leans on the firmer side rather than weak.
What a Successful Retest Looks Like, and What Failure Looks Like
For this retest to be read as a healthy continuation rather than a failed breakout, $WIF needs to hold above the support zone near $0.1862 and the FVG area, ideally with a daily close confirming buyers stepped back in.
Slipping and closing below that zone would put the breakout itself in question.
Support and Resistance Levels
Level | Price |
Resistance 3 | $0.3684 |
Resistance 2 | $0.3148 |
Resistance 1 | $0.2566 |
Support 1 | $0.1862 |
Support 2 | $0.1580 |
Support 3 | $0.1328 |
Bull, Base, and Bear Case
Scenario | Price Range | Key Trigger |
Bull Case | $0.2566 – $0.3684 | Price bounces from the FVG/support retest and clears resistance with volume. |
Base Case | $0.1862 – $0.2566 | WIF chops around the retest zone without a decisive move either way. |
Bear Case | $0.1328 – $0.1862 | The retest fails, support breaks, and price falls back toward the old channel range. |
Glossary
Descending channel: A downtrend boxed in by two parallel, downward-sloping lines. Breaking out of one doesn't guarantee the next leg holds, which is exactly why the retest that follows matters so much.
Breakout: A move where price pushes decisively past a chart boundary, like a channel or trendline, often followed by a pullback to retest that same level before continuing.
Fair value gap (FVG): A gap left on the chart when price moves so fast in one direction that it skips over a price range without much trading happening there. Traders often watch these zones, as prices may revisit this area before continuing their move.
RSI: Short for Relative Strength Index, a momentum gauge running from 0 to 100. Readings above 70 are generally read as overheated, and below 30 as oversold.
Liquidation: What happens when an exchange force-closes a leveraged position because the trader can no longer cover a potential loss. Heavy liquidation totals stacking on one side often line up with sharp, fast price moves.
Methodology
This Dogwifhat price prediction starts with a daily WIF/USDT chart on Binance, viewed through TradingView. It's paired with live data on price, market cap, supply, exchange volume, and liquidations.
Every level cited here comes straight from that chart; nothing is pulled from an outside calculator or rounded estimate. Volume and liquidation figures are sourced from CoinGlass and reflect the snapshot at the time of writing.
Disclaimer: This article is for informational purposes only and does not constitute financial or investment advice. The bull, base, and bear scenarios above are derived from technical chart patterns and carry meaningful uncertainty. Meme tokens such as Dogwifhat can move by double-digit percentages within a single session, and any of these outcomes could fail to materialize. Past performance and chart patterns do not guarantee future results. Only invest funds you can afford to lose, and consult a licensed financial advisor before making investment decisions.
Also read:
















