Aave Price Prediction September 2026: AAVE’s $250 Breakout Setup


Aave launched in 2017 as ETHLend before rebranding in 2018 and has since grown into one of the largest lending protocols in DeFi, with billions of dollars in deposits moving through it at any given time.
Unlike most tokens, its size and AAVE's market cap trade at a steep discount to the value actually locked in its protocol, a gap that keeps coming up whenever the chart is at a decision point like this one.
$AAVE currently sits at $131.65, down sharply on the day.
Anyone running an Aave price prediction September 2026 search right now wants to know whether the daily rising trendline holds and whether the weekly chart's freshly broken channel boundary holds too, or whether this pullback turns into something bigger on both timeframes.
Price Today: Live Data and 24-Hour Change
| Metric | Value |
| Price | $131.65 |
| 24H Change | -7.5% |
| 24H Range | $126.32 - $143.14 |
| Market Cap | $2.034B |
| Fully Diluted Valuation | $2.11B |
| 24H Trading Volume | $517.243M |
| Total Value Locked (TVL) | $18.166B |
| Circulating Supply | 15.424M |
| Total Supply | 16M |
| Max Supply | 16M |
Source: Market data taken from chart and market snapshots, data as of Aug 25, 2026. Figures may vary slightly across other tracking websites.
Key Takeaways
-
AAVE trades at $131.65, down 7.5% on the day, after opening at $132.32 and printing a high of $136.41.
-
The daily chart shows price still respecting a rising trendline, with resistance stacked at $145.29, $163.85, and $180.31.
-
The weekly chart shows AAVE broke out of a long descending channel, formed a new ascending channel, cleared that channel's upper boundary on strong volume, and is now retesting that broken boundary from above.
-
A hold of the $122.72 daily support and the weekly channel boundary keeps the bullish structure intact, losing both points toward the trendline first, then $102.40.
-
A market cap of $2.034B against a TVL of $18.166B is a wide gap for a top-tier lending protocol, and it's the fundamental backdrop behind every bullish case on this chart.
Technical Analysis: Daily Trendline Structure
$AAVE has been climbing inside a channel defined by a rising trendline since its move off the lows, and every rejection from resistance so far has come back down to test either the $122.72 support shelf or the trendline underneath it, not broken through either one.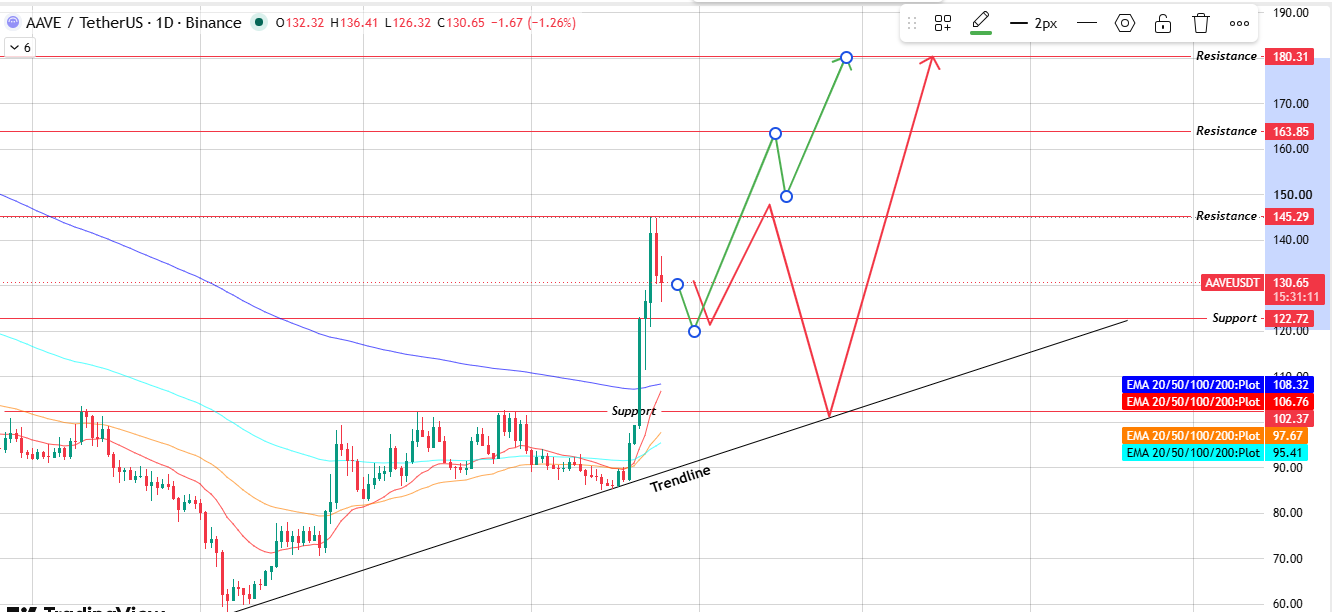
Source: Chart Taken From TradingView.
The sequence to watch: if the price reaches the support zone and volume shows up on the bounce, it has a path to clear $145.29 and continue toward $163.85 and then $180.31.
If price instead gets rejected at resistance again, the more likely path is a return to the support zone; a clean break of that zone would send price down to retest the trendline before any next move higher.
That distinction matters. A bounce off support with no volume behind it tends to fail at the next resistance test, while a volume-backed bounce is what's needed to actually clear a level rather than just poke at it.
Weekly Channel Breakout and Retest
The bigger structural story sits on the weekly chart. AAVE first broke out of a long descending channel, clearing its upper boundary after months of lower highs and lower lows. That breakout led into a new, tighter ascending channel.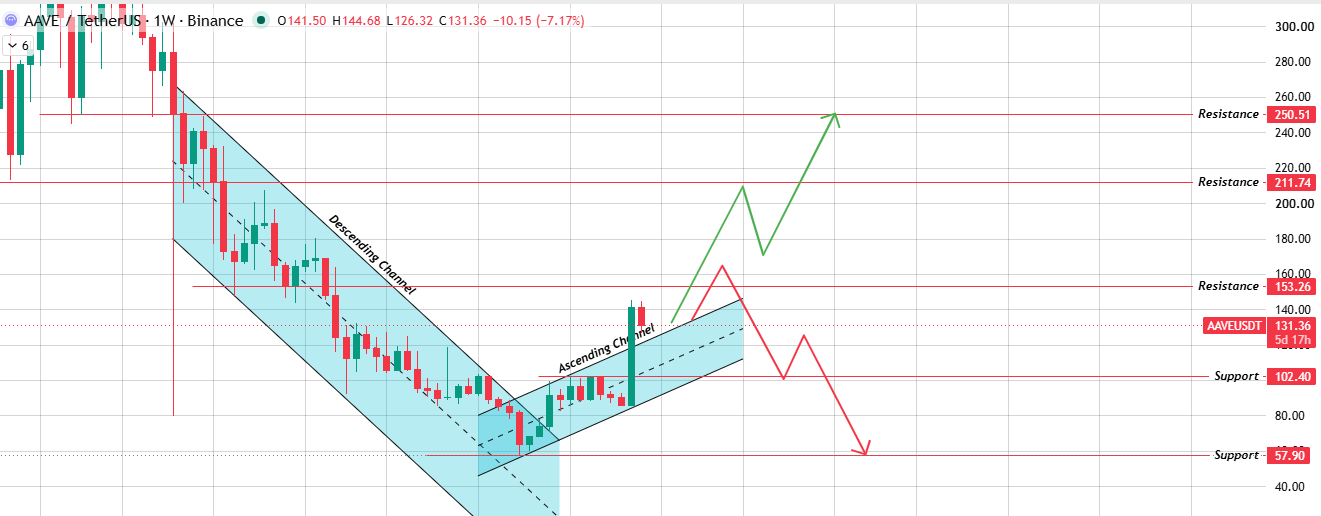
Source: Chart Taken From TradingView .
$AAVE then broke above that ascending channel's upper boundary too, on strong volume, before pulling back down to retest that same broken boundary as support.
That retest is the key thing happening in real time. If volume returns and the boundary holds as support, the path opens toward $153.26, then $211.74, and $250.51 further out.
If AAVE can't hold that boundary, the weekly structure argues for a drop back toward the $102.40 support, with $57.90 as the level below that.
EMA Levels (Daily Chart)
| EMA | Value |
| EMA 20 | $108.32 |
| EMA 50 | $106.76 |
| EMA 100 | $102.37 |
| EMA 200 | $97.67 |
All four EMAs are stacked below the current price and below each other in the expected order, which keeps the daily trend structurally bullish.
This cluster roughly lines up with the $97-$108 zone, just under the $102.40 weekly support, meaning that area carries extra weight as a floor if $122.72 breaks.
Technical Analysis: Daily Chart Support and Resistance
| Level Type | Price |
| Resistance 3 | $180.31 |
| Resistance 2 | $163.85 |
| Resistance 1 | $145.29 |
| Support 1 | $122.72 |
Technical Analysis: Weekly Chart Support and Resistance
| Level Type | Price |
| Resistance 3 | $250.51 |
| Resistance 2 | $211.74 |
| Resistance 1 | $153.26 |
| Support 1 | $102.40 |
| Support 2 | $57.90 |
Aave Price Prediction September 2026: Bull, Base, and Bear Cases
| Scenario | Level | Setup | Invalidation |
| Bull | $145.29 - $180.31 | Price holds the rising trendline, bounces off $122.72 support on rising volume, clears $145.29, then $163.85, and pushes toward $180.31. | Daily close back below $122.72 |
| Base | $122.72 - $145.29 | AAVE keeps ranging between support and resistance, with rejections at $145.29 sending the price back to test $122.72. repeatedly until a catalyst forces a break either way. | Extended chop without a decisive move past either boundary |
| Bear | Below $122.72 | The $122.72 support breaks and price falls to retest the rising trendline itself. | Reclaim and hold above $122.72. |
Aave Price Prediction September 2026: Bull, Base, and Bear Cases
| Scenario | Level | Setup | Invalidation |
| Bull | $153.26 - $250.51 | The ascending channel's upper boundary holds as support on the retest, and volume returns, and price pushes onto clear $153.26, then $211.74, and $250.51. | Weekly close back inside the ascending channel, below the broken boundary |
| Base | $102.40 - $153.26 | Price holds above $102.40 but can't reclaim the channel boundary with conviction, keeping AAVE range-bound on the weekly timeframe. | Extended weekly consolidation without a decisive close on either side |
| Bear | $102.40 - $57.90 | AAVE fails to hold the ascending channel's upper boundary as support, breaks back below the level with volume, and falls toward $102.40, with $57.90 as the level below that. | Reclaim and hold above the channel boundary. |
On-Chain and Fundamental Drivers
Aave's TVL of roughly $18.166B keeps it as one of the largest lending protocols in DeFi, and that scale is the backbone of any longer-term bull case, since the protocol earns real revenue from real borrowing and lending activity rather than pure speculation on the token.
Circulating supply sits at 15.424M against a hard cap of 16M, so dilution from new emissions isn't a meaningful overhang the way it is for many other tokens.
The gap between market cap ($2.034B) and TVL ($18.166B) is unusually wide for a top-tier lending protocol, which is one reason AAVE keeps coming up in undervalued-relative-to-fundamentals discussions.
That gap is also why the weekly chart's channel breakout got attention in the first place; a strong-volume breakout on the higher timeframe tends to draw more conviction when the fundamentals already support a re-rating, rather than a breakout happening in isolation.
September Catalysts That Could Move the Price
Continued rollout of newer Aave markets and vaults is one lever worth tracking, along with any governance proposals around fee switches or treasury use.
Broader risk appetite in crypto, tied closely to Bitcoin and Ethereum price action, tends to drag AAVE with it given how much of its TVL sits on Ethereum.
Stablecoin market growth is another factor, since Aave's lending volume is closely tied to how much stablecoin supply is actively being borrowed and deposited.
Weekly candle volume is worth watching on its own as a catalyst-confirming signal: the channel boundary retest on the weekly chart needs a volume pickup to hold as support, so a low-volume weekly close near that boundary would be a caution sign even if the daily chart looks fine in isolation.
None of this is guaranteed to hit in September; these are simply the factors worth watching alongside the chart.
What Analysts Are Forecasting
Price target estimates for $AAVE vary widely depending on the source and the assumptions behind them, and there isn't broad agreement on a single September number.
The more reliable approach is to treat the technical levels above as the actual forecast: $145.29 and $163.85 are the near-term levels bulls need to clear, $122.72 is the level bears need to break, and the weekly channel boundary retest is the swing factor that decides which range the rest of the quarter falls into.
Long-Term Outlook: 2027 to 2030
Zooming out past September, Aave's trajectory likely tracks two things more than anything else: whether DeFi lending keeps growing as a share of on-chain activity and whether Aave holds its position as a top protocol by TVL as competition increases.
If both hold, the current gap between market cap and TVL is the kind of thing that tends to close over a multi-year horizon rather than a single month.
If a competitor pulls meaningful TVL away, or regulation slows DeFi lending growth broadly, that gap can just as easily stay wide indefinitely.
Long-range targets this far out carry a wide margin of error and should be treated as scenarios, not commitments.
The weekly chart is really the one to revisit for this longer horizon. A successful hold of the ascending channel's upper boundary in September, followed by a clean run through $153.26, $211.74, and $250.51 over the following quarters, is the technical path that would support a genuinely bullish multi-year story rather than just a short-term bounce.
Risks That Could Invalidate This Forecast
This entire technical picture rests on two levels holding at the same time: the daily rising trendline and the weekly ascending channel's upper boundary.
A confirmed daily close below $122.72, followed by a trendline break, would invalidate the near-term bullish case.
A failure to hold the weekly channel boundary as support, especially on rising volume to the downside, would point toward $102.40 and open the door to $57.90.
Beyond the chart, a broad crypto market downturn, a security incident on the protocol, or a sharp drop in DeFi TVL industry-wide would all override this technical setup regardless of where price sits.
How to Buy and Store It Safely
AAVE trades on most major centralized exchanges and can also be acquired directly through decentralized exchanges paired against ETH or stablecoins.
Stick to platforms with deep order books, since thin liquidity spots see wider slippage during volatile candles.
For storage, small amounts are fine on an exchange, but larger holdings belong on a hardware wallet like a Ledger or Trezor.
If AAVE is being used within the Aave protocol itself, for staking, or as collateral, it's worth understanding the smart contract risk that comes with that, separate from the price risk of holding the token.
Glossary
Rising trendline: A line connecting a series of higher lows, used to gauge whether an uptrend is still intact.
Descending channel: Two parallel falling trendlines bounding the price until it breaks one side.
Ascending channel: Two parallel rising trendlines bounding the price until it breaks one side.
Resistance: A level where selling has historically capped price.
Support: A level where buying has historically stepped in.
Retest: A move back to a broken level to see whether it now acts as support or resistance in the opposite direction.
Methodology
This Aave price prediction September 2026 piece is built from daily and weekly chart structure, live market data, and standard technical tools, including trendline and channel analysis. Every scenario includes a clear invalidation level so readers can track whether the thesis still holds as new candles print.
Disclaimer: This article is for informational purposes only and does not constitute financial advice. Cryptocurrency markets are highly volatile, and prices can move sharply in either direction without warning. Always do independent research and consult a licensed financial advisor before making investment decisions.
Also read:

















