Injective Price Prediction Today: Can INJ Push Past the $5.575 Level?


INJ Grabs Attention With a Big Announcement
Injective has had plenty to talk about lately, and that's part of what's driving this Injective price prediction.
On 24 August 2026, Injective's official account posted a rundown of recent milestones: SEC Transfer Agent Registration, MiCA authorization in the EU, major enterprises such as LG tokenizing assets on the network, a unified stablecoin standard adopted across multiple chains, and a new AI SDK aimed at helping developers ship dApps faster.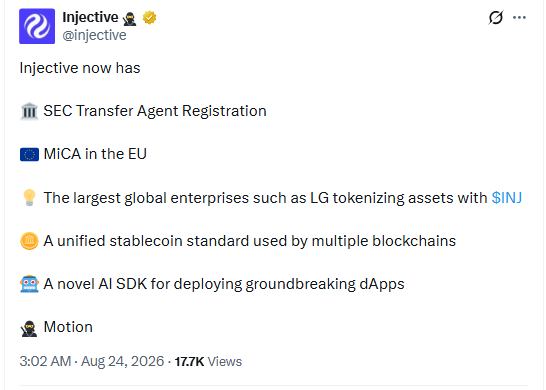
News flow like this tends to move sentiment quickly in crypto, and $INJ's chart has clearly responded.
INJ's Market Cap and Valuation Right Now
As per CoinMarketCap data, INJ was changing hands at $5.27, up 9.62% over 24 hours, with market capitalization sitting at $527.1 million, also up 9.61% on the day.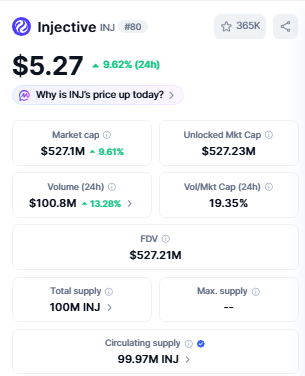
The unlocked market cap comes in almost identical at $527.23 million, and the fully diluted valuation reads $527.21 million.
24-hour trading volume stood at $100.8 million, up 13.28%, giving a healthy volume-to-market-cap ratio of 19.35%.
$INJ has a circulating supply of 99.97 million tokens out of a total supply of 100 million, and unlike many large-cap tokens, it carries no fixed maximum supply figure.
Futures Desk: Volume, Liquidations and Positioning
According to Coinglass data, INJ's price performance shows -1.55% over 4 hours, +9.27% over 24 hours, +29.22% over 7 days, +1.96% over 30 days, -7.25% over 90 days, +68.56% over 180 days, +25.82% year-to-date, and +404.10% all-time.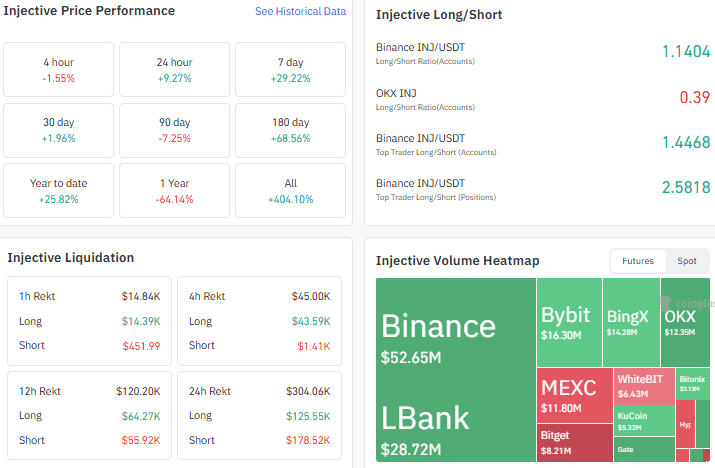
On the futures volume heatmap, Binance leads with $52.65 million, followed by LBank at $28.72 million, Bybit at $16.30 million, BingX at $14.28 million, and OKX at $12.35 million.
Liquidations over the last 24 hours totaled $304.06K, split between $125.55K in longs and $178.52K in shorts, while the sharper 4-hour window saw $43.59K.
The Binance long/short account ratio reads 1.14, while OKX shows a more cautious 0.39; notably, the Binance top-trader position ratio jumps to 2.58, hinting that larger players are positioned considerably more long than the broader account base.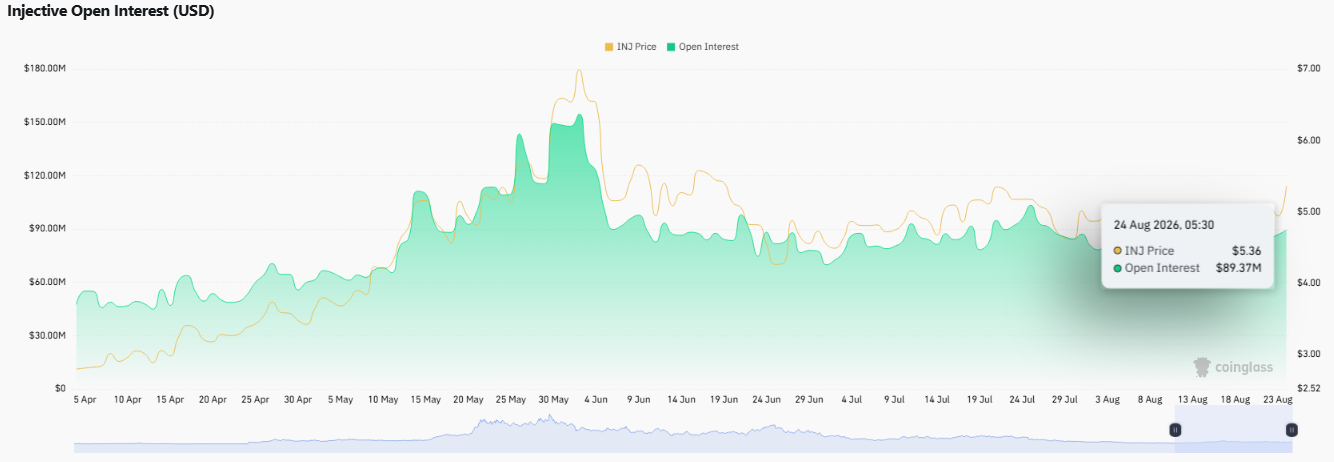
Open interest stood at $89.37 million as of 05:30 UTC on 24 August, tracking a price of $5.36 at that moment.
Chart Talk: Has INJ Really Turned the Corner?
INJ's chart tells a story in three acts. First came a clean downtrend, then a stretch of consolidation, and more recently a descending channel that has just been broken with a large green candle on rising volume.
Over the past few trading sessions, $INJ has held above that broken channel, a bullish sign on its own, but it hasn't yet cleared a major resistance level.
According to the TradingView chart for INJ/USDC The 14-period RSI sits at 63.08, firmly in bullish territory but with room to run before overbought.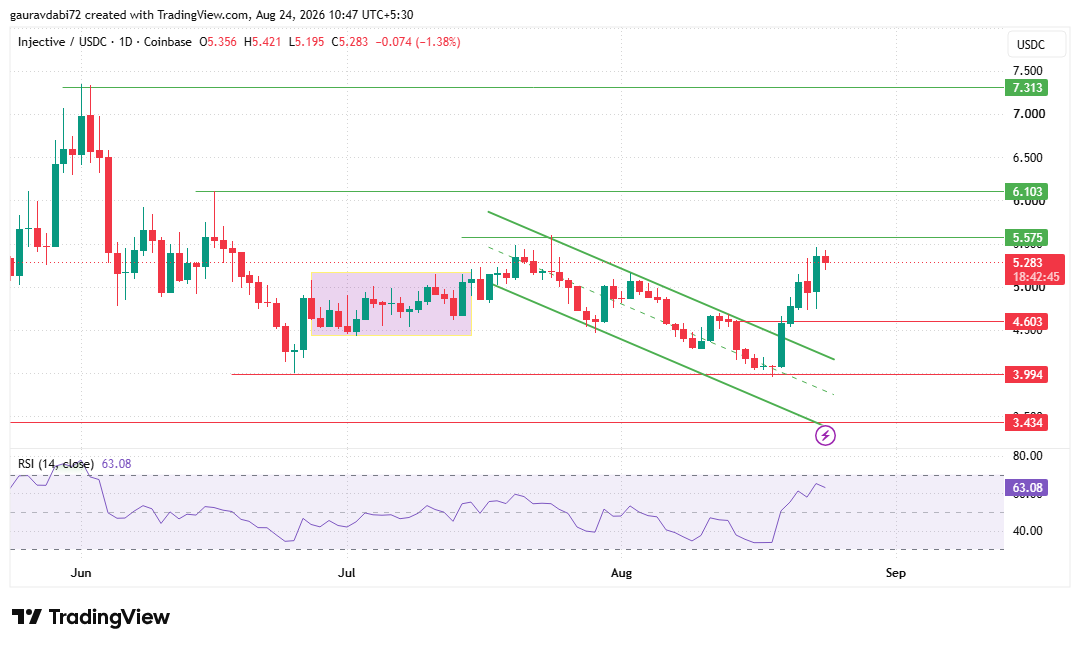
The level that matters most right now is $5.575. Breaking above it and holding there is what would confirm a fresh leg higher for this Injective price prediction, opening the path to $6.103 and, further out, $7.313.
If INJ can't hold above $5.575, the more likely outcome is a sideways stretch between $4.603 and $5.575.
Should momentum fade instead, support levels line up at $4.603, $3.994, and $3.434.
Bull, Bear, or Sideways? Three Ways This Could Play Out
Here's how the three scenarios in this Injective price prediction line up, based on the levels discussed above:
| Scenario | What Would Trigger It | Key Levels to Watch |
| Bullish | $INJ clears the $5.575 hurdle and holds above it on strong volume. | Opens the door to $6.103, with $7.313 in view further out. |
| Neutral / Range-bound | Price fails to hold above $5.575 and drifts sideways instead. | Likely range of $4.603 – $5.575. |
| Bearish | Momentum fades and $INJ slips back under the channel it just broke out of. | Support at $4.603, then $3.994, then $3.434. |
Behind the Chain: How Is the Injective Network Holding Up?
Zooming out from price, on-chain data tracked via Injective's own explorer paints a fairly active network.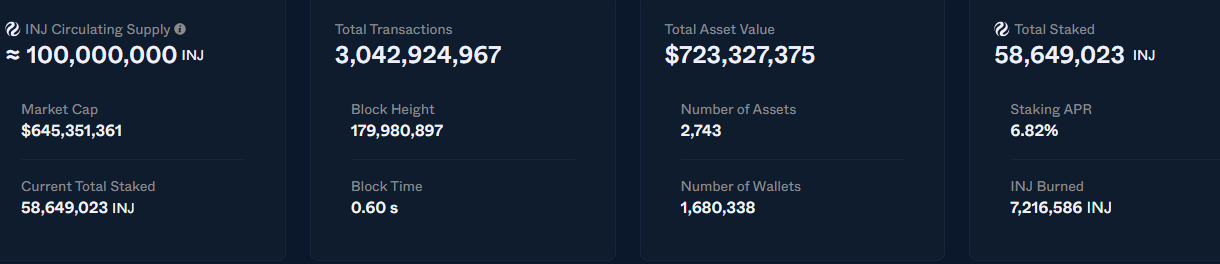
Circulating supply stands at roughly 100,000,000 $INJ, with a market cap reading of $645,351,361 on that platform, a small variance from CoinMarketCap's figure, which is typical when different trackers snapshot supply and price at slightly different times.
The network has processed over 3.04 billion total transactions across a block height of 179,980,897, with an average block time of just 0.60 seconds.
Total assets on the network number 2,743, together valued at roughly $723.3 million.
On the staking side, 58,649,023 $INJ is currently staked, more than half of the circulating supply, earning a staking APR of 6.82%, while 7,216,586 INJ has been burned to date.
The network also counts 1,680,338 wallets, a rough proxy for how widely $INJ has been distributed and used.
The Bigger Picture
As per the CoinGabbar analyst, between the SEC and MiCA milestones, rising open interest, and a chart that's finally broken its downtrend, INJ has plenty of tailwinds feeding into this Injective price prediction.
That said, $5.575 remains an unbroken wall, and until it gives way, sideways chop between that level and $4.603 is just as plausible as a breakout.
Disclaimer: This article is intended purely as market analysis based on publicly available price, derivatives, and on-chain data and should not be read as investment advice. Readers are encouraged to do their own research before making any decisions.
Also read:












.webp)




