Injective Price Prediction: $INJ vs $BTC $1B Report, Next Target?


$INJ just broke out of a weeks-long downtrend, jumping nearly 10% while the project's own team stirred up a debate comparing INJ's shrinking supply to Bitcoin's hard cap.
Add a fresh $1 billion real-world asset migration headline into the mix, and this Injective price prediction digs into whether the chart backs up the excitement or if traders are getting ahead of themselves.
Injective is trending again as traders watch the weekly chart for a breakout, with the INJ price prediction for 2026 to 2030 key levels.
Market data was checked on September 7, 2026, at 03:32 UTC-3.
Injective Price Prediction Today: Market Overview
| Metric | Value |
| Price | $5.5858 |
| 24h Change | +10.11% |
| Market Cap | $557.69M |
| FDV | $557.86M |
| 24h Volume | $89.25M |
| Vol/Mkt Cap (24h) | 15.64% |
| Total Supply | 100M INJ |
| Max Supply | -- |
| Circulating Supply | 99.97M INJ |
Source: Data from CoinMarketCap as of September 7, 2026, at 03:32 UTC-3. Figures may vary slightly across other tracking websites.
Injective Liquidation and Volume Data
Futures data from Coinglass shows shorts getting squeezed as INJ broke out:
| Timeframe | Total Liquidated | Longs | Shorts |
| 1h | $2.63K | $2.63K | $0 |
| 4h | $8.53K | $6.44K | $2.09K |
| 12h | $87.39K | $15.75K | $71.64K |
| 24h | $122.15K | $38.65K | $83.50K |
Short positions took the bulk of the damage over 12 and 24 hours, suggesting the breakout caught bearish traders leaning the wrong way.
On the futures volume side, Binance leads with $72.24M, followed by LBank at $41.25M, OKX at $18.03M, Bybit at $18.04M, Hyperliquid at $17.11M, BingX at $14.20M, MEXC at $9.92M, Bitget at $9.86M, KuCoin at $7.21M, and Gate at $5.37M.
This futures activity is separate from INJ's CoinGecko spot volume figure above.
Injective News Today: $1 Billion RWA Migration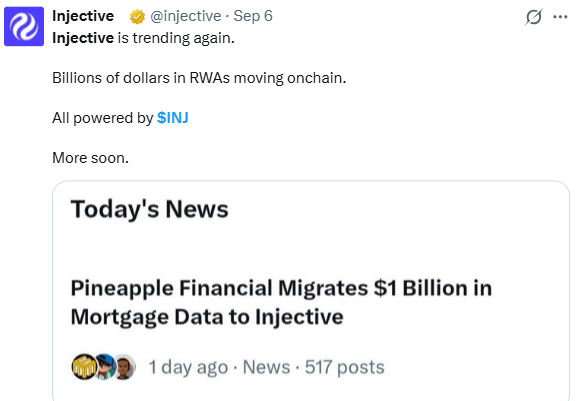
Source: Data From X
The Injective team said billions of dollars in real-world assets are moving on-chain through the network, pointing to Pineapple Financial migrating $1 billion in mortgage data to Injective as a recent example, with more updates promised soon.
Injective Price Prediction 2026: "Ultrasound Money" Supply Debate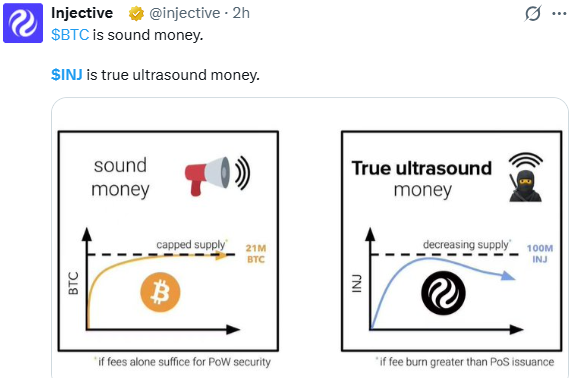
The Injective team posted a chart comparing Bitcoin's fixed 21 million supply to INJ's declining supply, arguing that if fee burn outpaces new issuance, INJ's shrinking supply makes it more scarce over time than Bitcoin's capped one.
CoinGabbar could not independently verify the underlying burn-versus-issuance math behind this claim; it's presented here as the project's own stated position, not confirmed data.
Injective Technical Analysis & $INJ Outlook
Pair: INJ/USD · Market: Spot (Crypto) · Timeframe: 4H · Source: TradingView · Timestamp: September 7, 2026, 01:27 UTC-3
INJ is trading at $5.5858, after breaking above a descending channel it had been trading inside since late August.
Price pushed up sharply through the channel's upper boundary and is now testing the area just above it.
The EMA cluster sits just below the current price, with the 20 EMA at $5.1151 and the 50 EMA at $5.0433, both now acting as support beneath the breakout.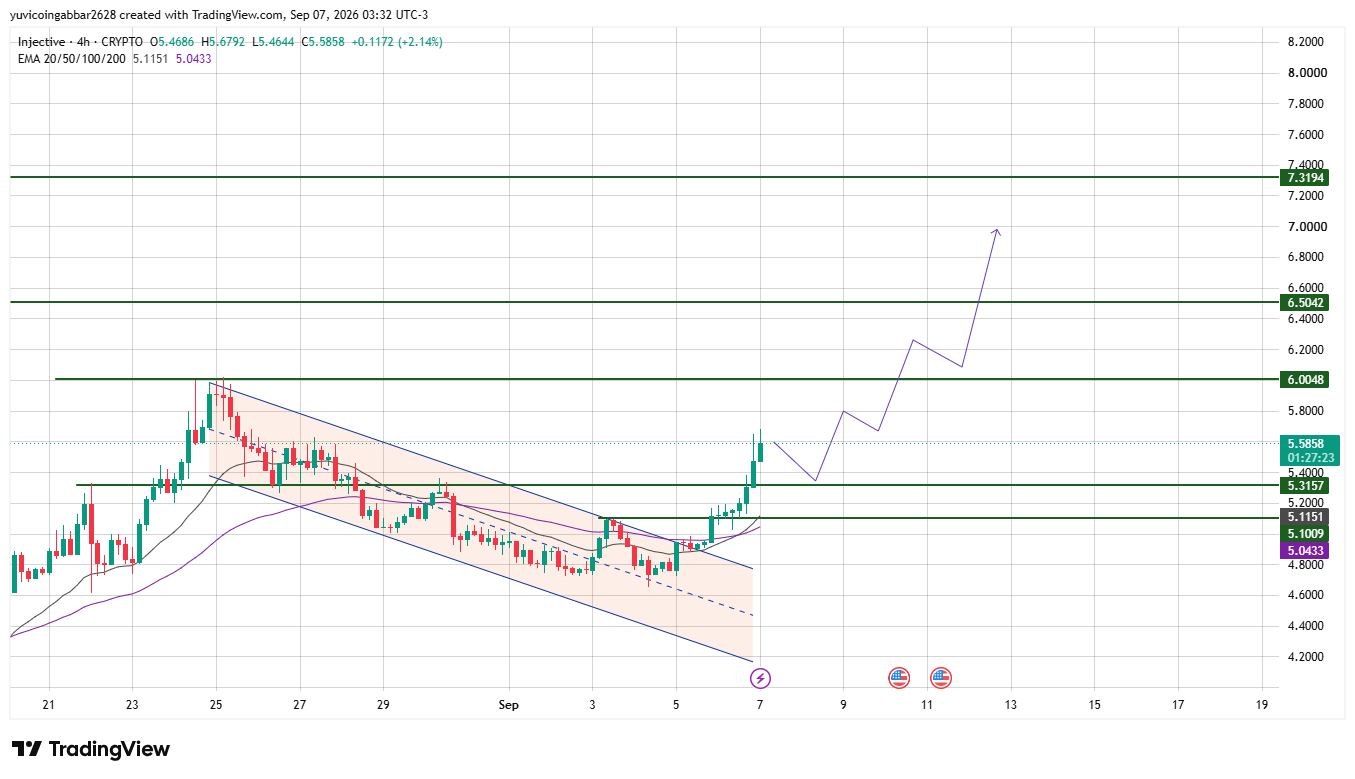
Injective Price Forecast: $INJ Future Price Key Levels
| Level Type | Price |
| Resistance 3 | $7.3194 |
| Resistance 2 | $6.5042 |
| Resistance 1 (nearest) | $6.0048 |
| Immediate Price Reference | $5.5858 |
| First Confirmed Support | $5.3157 |
| Deeper Support | $5.1151 |
Injective Forecast: Bull Case vs Bear Case
Bull case: Holding above $5.3157 and clearing $6.0048 would confirm the channel breakout is holding, opening the path toward $6.5042 and eventually $7.3194.
Bear case: A close back below $5.3157 would put the breakout in doubt and suggest the price is slipping back inside the old channel.
Losing the EMA cluster near $5.1151 to $5.0433 would expose INJ to a retest of the channel's lower boundary.
Scenarios, Triggers, and Invalidation
| Scenario | Trigger | Likely Outcome | Invalidation Point |
| Channel breakout (bullish) | Hold above $5.5858 and break $6.0048 | Push toward $6.5042 | Close below $5.3157 |
| Range hold | Consolidation between $5.3157-$6.0048 | Sideways chop before next leg | Break of either bound |
| Breakdown (bearish) | Close below $5.1151 | Retest lower channel boundary | Reclaim above $5.3157 |
Can INJ Reach $7.3194?
$7.3194 is the highest resistance level marked on the chart.
Getting there would need INJ to clear $6.0048 first, then $6.5042, a multi-stage move that would require the breakout momentum to keep building rather than fade at the first resistance test.
INJ vs BTC
Bitcoin is trading at $79,448.60 today, showing much greater stability compared to INJ's smaller-cap volatility.
While a bitcoin price prediction usually centers on macro trends and institutional demand, INJ's price action depends more on chart-level breakouts and altcoin momentum, making it a higher-risk, higher-reward play compared to BTC.
Injective Price Prediction 2026-2030 : $INJ Long-Term Key Levels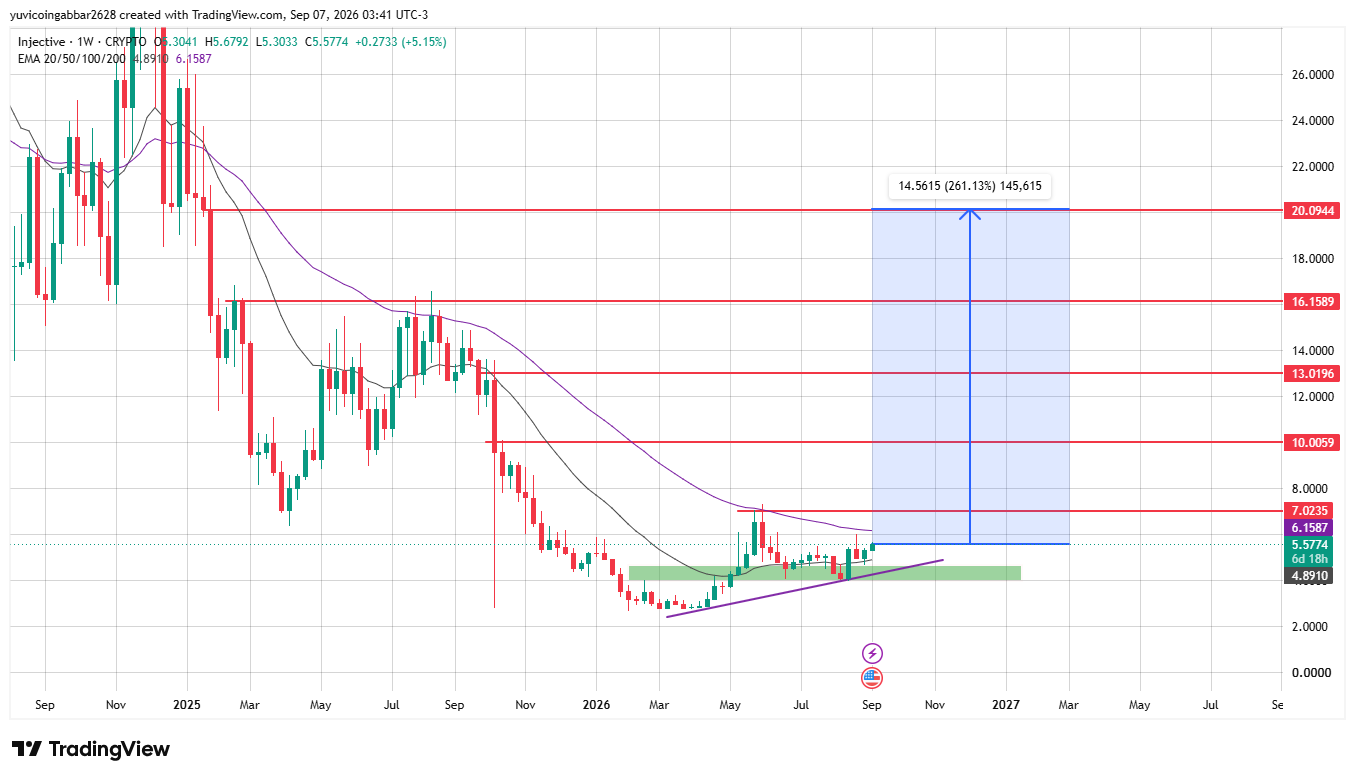
Current Price: $5.5858 | The nearest resistance zone starts at $7.0235
$INJ Price Prediction 2026
-
Bear Case: $4.89 if the current support breaks, the price could fall back here
-
Base Case: $7.02 the first major resistance, where price has already been rejected multiple times
-
Bull Case: $10.00 if strong momentum builds up, this level could be touched by the end of the year
$INJ Price Prediction 2027
-
Bear Case: $6.15 a slight consolidation above the 2026
-
Base Case: $10.00 a level that's both a psychological number and a chart resistance
-
Bull Case: $13.02 the next clear resistance line
$INJ Price Prediction 2028
-
Bear Case: $8.00 a retest level from the previous cycle
-
Base Case: $13.02 the 2027 bull area becomes the 2028 base if momentum holds
-
Bull Case: $16.16 the next
Reasoning: The gap between $13.02 and $16.16 is fairly wide (about 24%), so this move may take some time a full year gap looks realistic.
$INJ Price Prediction 2029
-
Bear Case: $10.00 if the cycle slows down, this level could become support again
-
Base Case: $16.16
-
Bull Case: $20.09 the target zone
Reasoning: TradingView's own projection tool also points to $20.0944 as a key level, which makes this a realistic bull target level for 2029.
$INJ Price Prediction 2030
-
Bear : $13.00
-
Base : $20.09 the chart's target zone
-
Bull : $26.00+ a retest of the old all-time high zone (from November 2024)
Reasoning: If the full bull structure plays out step by step from 2026 to 2029, price could climb back close to its previous cycle high by 2030.
This is the most aggressive but still chart-supported scenario if the trend continues Targets are not fixed consider them as levels and analyst view.
Injective Price Prediction: Expert View
According to CoinGabbar analysts , The channel breakout and the heavy short liquidations both point to real short-term momentum.
Whether the supply narrative adds lasting fuel or fades as talking-point noise, $5.3157 is the level that decides if this breakout sticks.
Disclaimer: This piece is for informational purposes only and isn't financial advice. The levels and scenarios above are based on technical chart analysis and publicly available data at the time of writing, and crypto markets can move sharply within hours, so past patterns don't guarantee future outcomes. It's worth doing independent research and considering your own risk tolerance before acting on any of the levels discussed here.

















