Litecoin Price Prediction: $LTC Channel Breakdown, Next Price Target?

.jpg)
$LTC just broke down from the rising channel it had been trading in since late June, and the 4H chart is now flashing a bearish EMA crossover on top of it.
Litecoin is a peer-to-peer cryptocurrency built as a faster, lighter alternative for everyday payments, according to its own project materials.
ThisLitecoin Price Prediction breaks down whether LTC stabilizes or extends this pullback over the next two to three weeks. Here's what the short-term and long-term charts show.
Litecoin Price Prediction Today: Market Overview
| Metric | Value |
| Price | $44.099 |
| 24h Change | -1.08% |
| Market Cap | $3.41B |
| Fully Diluted Valuation (FDV) | $3.7B |
| 24h Volume | $138.5M |
| Vol/Mkt Cap (24h) | 4.02% |
| Total Supply | 84M LTC |
| Max Supply | 84M $LTC |
| Circulating Supply | 77.45M $LTC |
| Holders | 113.99K |
Source: Data from CoinMarketCap as of 3/08/2026. Figures may vary slightly across other tracking websites.
LTC Price Prediction Chart: Short-Term Technical Analysis
Pair: LTC/USD · Market: Spot (Crypto) · Timeframe: 4H · Source: TradingView · Timestamp: August 3, 2026, 16:46 UTC+5:30
The 4H $chart shows LTC trading at $44.099; after breaking down from the rising ascending channel, it had held since late June, a structural feature kept distinct from the EMAs below.
More significantly, the $chart flags a bearish EMA crossover: EMA (Exponential Moving Average, a momentum indicator weighting recent candles more heavily) 20 has crossed below EMA 50, with EMA 20 now at $44.631 and EMA 50 at $45.196, both sitting above the current price as overhead resistance.
This crossover reinforces the channel breakdown as a genuine short-term momentum shift rather than a minor pullback.
RSI (14), the Relative Strength Index, where readings above 70 signal overbought and below 30 oversold, sits at 37.82, firmly bearish and approaching oversold territory.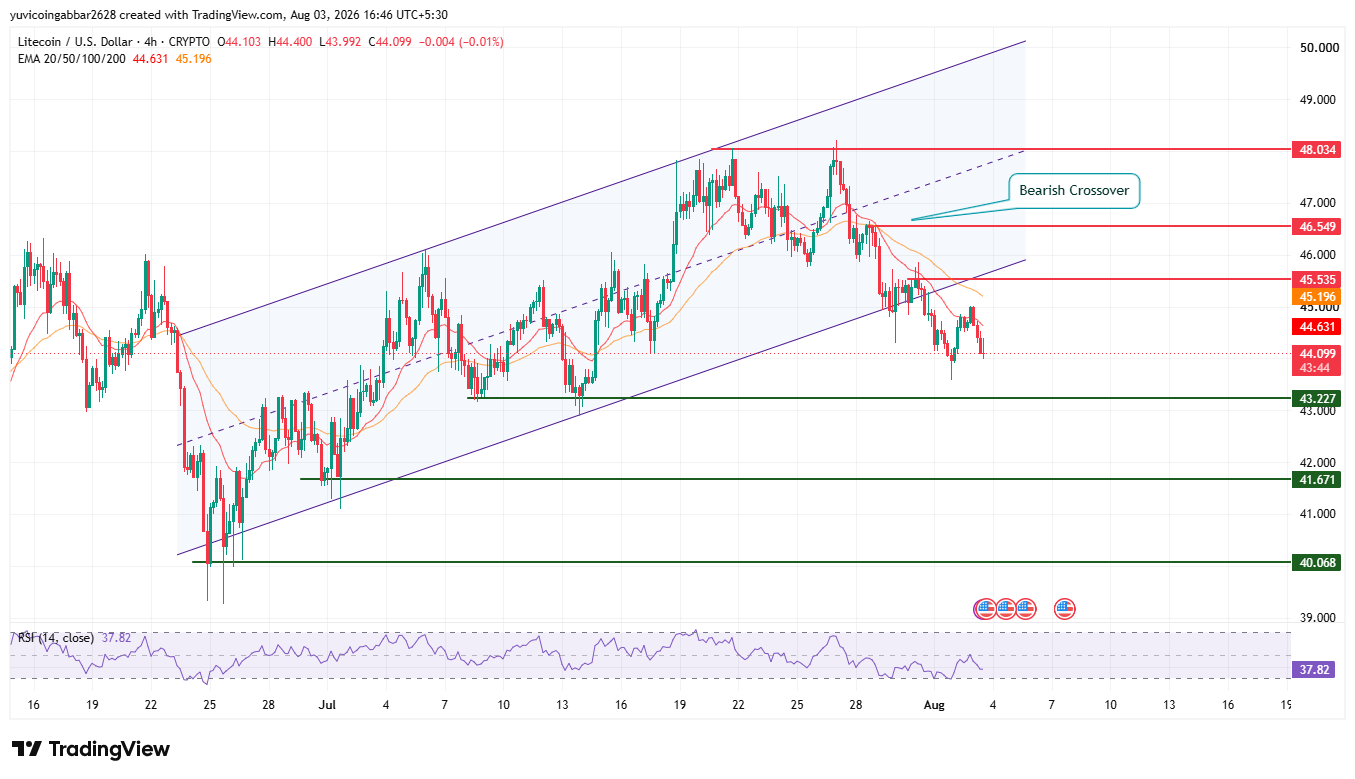
| Level Type (Short-Term, 4H) | Price |
| Resistance 3 | $48.034 |
| Resistance 2 | $46.549 |
| Resistance 1 (nearest) | $45.535 |
| $EMA 50 | $45.196 |
| EMA 20 (bearish crossover level) | $44.631 |
| Immediate Price Reference | $44.099 |
| First Support | $43.227 |
| Deeper Support | $41.671 |
| Structural Floor Support | $40.068 |
LTC Price Prediction Chart: Long-Term Technical Analysis
Pair: LTC/USD · Market: Spot (Crypto) · Timeframe: 1D · Source: TradingView · Timestamp: August 3, 2026, 16:54 UTC+5:30
On the daily chart , LTC is just below the $47.851 resistance zone and an $EMA crossover, with a rising trendline that has supported the price since July and a trendline that has broken and the price starting to fall again.
$EMA 20 sits at $45.354 and EMA 50 at $45.771, both above the current price at $44.157 and unreclaimed.
The $chart lays out two clear paths from here: a confirmed break above $47.851 would target $52.445, while a break of the $40.008 support would open $36.251 and eventually $29.873.
RSI (14) is at 42.39, neutral-to-bearish and below the midline.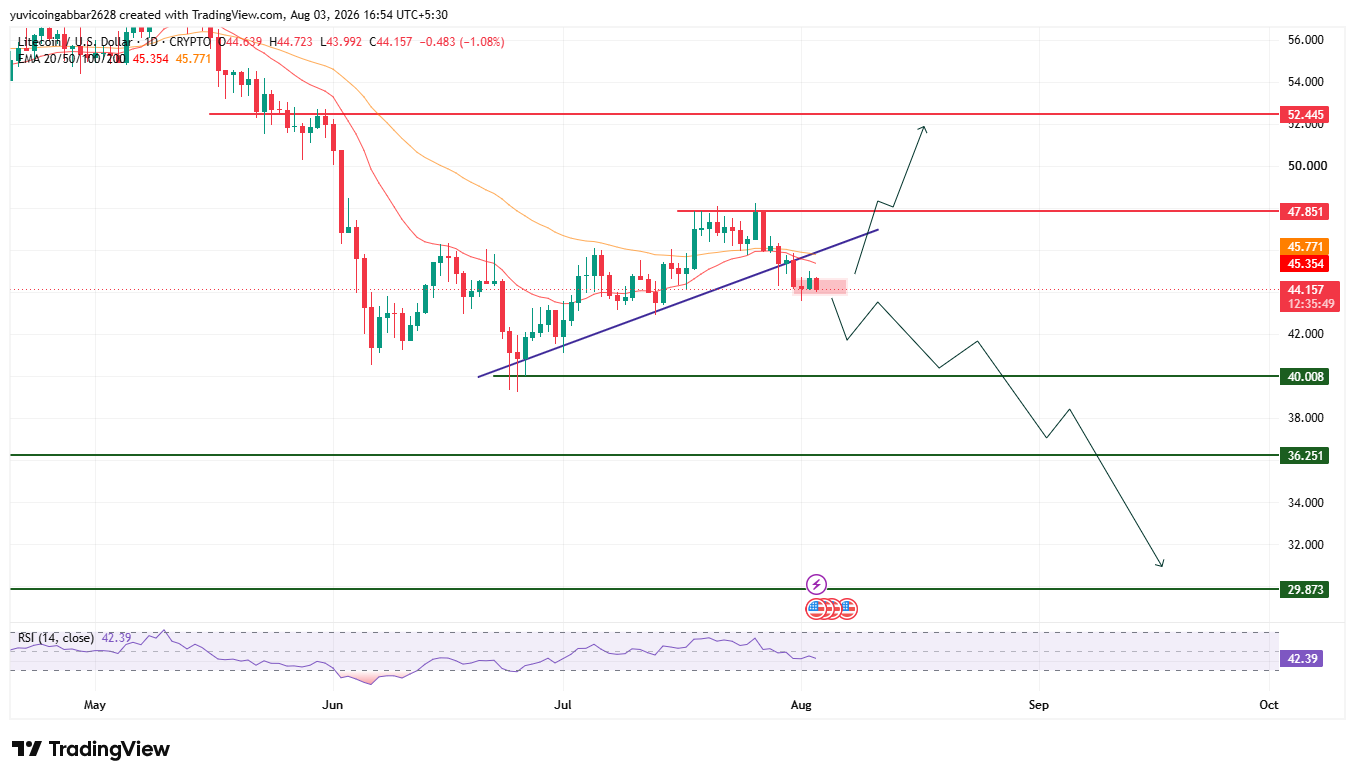
| Level Type (Long-Term, 1D) | Price |
| Resistance 1 | $52.445 |
| Resistance 2 (near-term breakout trigger) | $47.851 |
| $EMA 50 | $45.771 |
| $EMA 20 | $45.354 |
| First Support | $40.008 |
| Deeper Support | $36.251 |
| Structural Floor Support | $29.873 |
Litecoin Forecast: Bull Case vs. Bear Case
LTC price target 2026 Bull case: Reclaiming the 4H $EMA 20 at $44.631 and holding above $43.227 would be the first sign the channel breakdown is stabilizing.
A confirmed daily close above $47.851 would validate a bigger bullish structure, targeting $52.445.
LTC price target 2026 Bear case: A continued failure to reclaim $44.631, followed by a break below $43.227, would confirm the bearish $EMA crossover is playing out.
On the daily $chart, losing the rising trendline and the $40.008 support would open $36.251, with $29.873 as the deeper structural floor beyond that.
What Could Invalidate the Bullish Setup?
A rejection at the 4H $EMA 20 ($44.631) followed by a failure to hold $43.227 would confirm the bearish crossover is in control on the short-term chart.
More significantly, a price close below the rising trendline and $40.008 support would undermine the broader structure entirely, opening to $36.251 and eventually the $29.873 floor.
Litecoin Price Prediction Methodology
This forecast draws on multiple inputs rather than a single chart pattern: the short-term channel breakdown and bearish $EMA crossover, the long-term rising trendline and resistance zone, RSI momentum across both timeframes, and the broader market structure.
No single signal is treated as decisive on its own, and the measured-move target above is a conditional stretch scenario rather than a base-case expectation.
Litecoin Price Prediction 2026: Expert View
According to CoinGabbar analysts , the short-term and long-term charts are telling a fairly consistent story right now.
The 4H bearish EMA crossover and channel breakdown suggest near-term momentum has turned negative, while the daily chart shows LTC still holding below its rising trendline.
The $43.227-$44.631 zone is the key near-term battleground: losing it would likely accelerate the daily trendline test, while reclaiming it would give bulls a real shot at the $47.851 breakout level.
Until one of those resolves, this remains a market in transition rather than a confirmed trend either way.
Litecoin Price Prediction: Data Sources
Short-term price, $EMA, and RSI data referenced from a 4H LTC/USD chart via TradingView, timestamped August 3, 2026, 16:46 UTC+5:30. Long-term price, EMA, and RSI data referenced from a 1D LTC/USD chart via TradingView, timestamped August 3, 2026, 16:54 UTC+5:30. Market cap, FDV, volume, and supply data referenced from a CoinGecko-style market tracker.
Disclaimer: This piece is for informational purposes only and isn't financial advice. The levels and scenarios above are based on technical chart analysis and publicly available data at the time of writing, and crypto markets can move sharply within hours, so past patterns don't guarantee future outcomes. It's worth doing independent research and considering your own risk tolerance before acting on any of the levels discussed here.


















