Official Trump Price Prediction: TRUMP Eyes Wolfe Wave Rally to $4


Official Trump (TRUMP) launched on Solana in January 2025, just days before Donald Trump's inauguration, making it one of the most talked-about political meme coins to ever hit the market.
Backed by his name and brand, it drew massive early trading volume and became a case study in how fast a meme coin tied to a public figure can move.
Anyone searching for an official Trump price prediction today will find $TRUMP trading around $2.20, down 7.4% over the last 24 hours.
Its market capitalization sits close to $575.975 million on a circulating supply of roughly 261.881 million tokens.
Live Market Data
Metric | Value |
Price | $2.20 |
24h Change | -7.4% |
Market Cap | $575.975M |
Fully Diluted Valuation | $2.199B |
24h Trading Volume | $232.695M |
Circulating Supply | 261.881M |
Total Supply | 1B |
Max Supply | 1B |
24h Range | $2.18 – $2.41 |
Source: TRUMP market data taken from CoinMarketCap, data as of Sep 02, 2026. Figures may vary slightly across other tracking websites.
Exchange Volume
Exchange | 24h Volume |
OKX | $229.18M |
Binance | $200.17M |
Bybit | $45.16M |
Gate | $33.45M |
Bitget | $27.32M |
Hyperliquid | $14.15M |
Bitunix | $12.40M |
Source: Volume Heatmap Data Taken From CoinGlass, As of Sep 02, 2026
OKX and Binance together account for the vast majority of tracked futures volume, well ahead of every other venue.
That kind of concentration usually means large leveraged players are the ones driving price right now, not smaller retail flow spread across exchanges.
Liquidation Snapshot
Window | Total | Long | Short |
1h | $290.49K | $279.70K | $10.80K |
4h | $610.73K | $590.92K | $19.80K |
12h | $1.10M | $967.56K | $136.12K |
24h | $2.26M | $2.00M | $264.88K |
Source: Liquidation Data Taken From CoinGlass, As of Sep 02, 2026
Long positions account for the overwhelming share of liquidations across every window, with the 24-hour total alone crossing $2M on the long side.
That kind of one-sided flush typically shows up during a sharp pullback, where traders who bought the recent rally get forced out as price cools.
Key Takeaways
$TRUMP trades near $2.20, down 7.4% in the past day, after breaking out of a descending channel on the daily chart with a sharp move higher.
A Wolfe wave pattern on the chart is pointing toward an extended level near $4.07, well above current resistance levels.
A bounce from support with volume, followed by a break above resistance, could open the path toward $3.089, $3.489, and eventually $4.070.
A breakdown of current support levels could instead send prices toward lower levels at $1.830 and $1.364.
Long liquidations dominate every timeframe tracked, from 1h through 24h, pointing to a sharp shakeout of leveraged buyers.
Technical Analysis of Official Trump Price
Descending Channel Breaks With a Sharp Rally
The daily TRUMP/USDT chart on Binance shows price spending an extended stretch inside a descending channel before breaking clean above its upper boundary in a sharp, fast move.
That breakout carried price well above the channel and into the current trading range, where it's now consolidating after the initial push.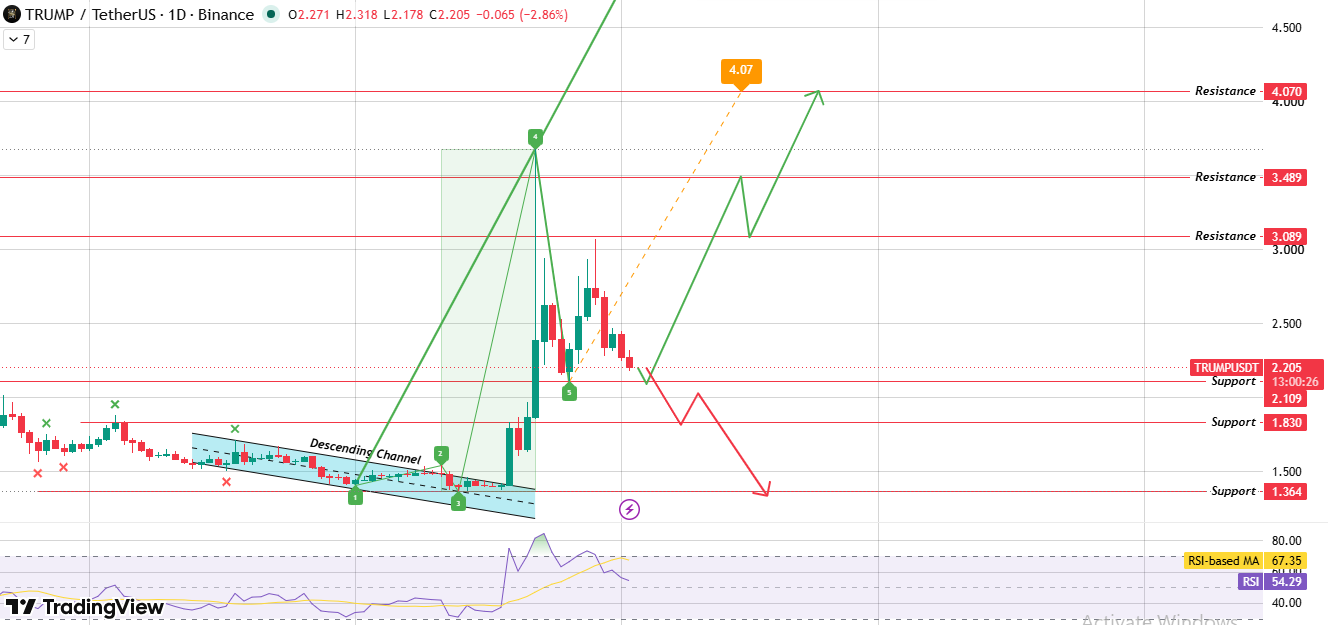
Source: Chart Taken From TradingView, As of Sep 2, 2026
If TRUMP finds support here and bounces with real volume behind it and then goes on to clear resistance at $3.089, that combination opens a path toward $3.489 and then $4.070 above.
If support instead breaks down, $TRUMP risks a slide toward lower levels at $1.830, with $1.364 as the next cushion below that.
Wolfe Wave Pattern Points to an Extended Level
A Wolfe wave structure is visible on the chart, a five-point pattern traders use to project longer-term price levels based on the geometry of recent swing highs and lows.
In this case, the pattern is projecting a level near $4.07, sitting well above the nearer resistance levels.
It's worth treating this as a longer-range level rather than something likely to play out immediately, since the pattern typically takes time to fully develop.
Momentum Sits in the Middle, Not at an Extreme
RSI on the daily chart currently reads 54.29, below the RSI-based moving average at 67.35.
That gap suggests momentum has cooled from the peak of the breakout rally, though the reading itself sits close to neutral rather than pointing to an overbought or oversold extreme.
What Confirms the Upside, and What Confirms the Breakdown
For the bullish scenario to gain real weight, $TRUMP needs to hold support and close above resistance at $3.089 on strong volume, ideally with the Wolfe wave levels staying intact as price climbs.
Without that volume confirmation, a push above resistance can just as easily fade back into range.
For the bearish scenario, a daily close below current support would be the signal that the breakout has failed and the deeper support levels are back in play.
Support and Resistance Levels
Level | Price |
Resistance 3 | $4.070 |
Resistance 2 | $3.489 |
Resistance 1 | $3.089 |
Support 1 | $2.109 |
Support 2 | $1.830 |
Support 3 | $1.364 |
Bull, Base, and Bear Case
Scenario | Price Range | Key Trigger |
Bull Case | $3.089 – $4.070 | TRUMP bounces from support with volume and clears resistance, keeping the Wolfe wave levels in play. |
Base Case | $2.109 – $3.089 | Price chops between support and resistance without a decisive move either way. |
Bear Case | $1.364 – $1.830 | Support breaks down, sending TRUMP back toward lower levels. |
Descending channel: A downtrend boxed in by two parallel, downward-sloping lines. Breaking out of one with a sharp move often signals a shift in short-term momentum, though it doesn't guarantee the new direction holds.
Wolfe wave: A five-point chart pattern traders use to project price levels based on the symmetry of recent swing highs and lows. It's read as a longer-range projection rather than an immediate signal.
RSI: Short for Relative Strength Index, a momentum gauge running from 0 to 100. Readings above 70 are generally read as overheated, and below 30 as oversold.
Liquidation: What happens when an exchange force-closes a leveraged position because the trader can no longer cover a potential loss. Heavy liquidation totals stacking on one side often line up with sharp, fast price moves.
Methodology
This official Trump price prediction starts with a daily TRUMP/USDT chart on Binance, viewed through TradingView. It's paired with live data on price, market cap, supply, exchange volume, and liquidations.
Every level cited here comes straight from that chart; nothing is pulled from an outside calculator or rounded estimate.
Volume and liquidation figures are sourced from CoinGlass and reflect the snapshot at the time of writing.
Disclaimer: This article is for informational purposes only and does not constitute financial or investment advice. The bull, base, and bear scenarios above are derived from technical chart patterns and carry meaningful uncertainty. Political and meme-linked tokens such as Official Trump can move by double-digit percentages within a single session, and any of these outcomes could fail to materialize. Past performance and chart patterns do not guarantee future results. Only invest funds you can afford to lose, and consult a licensed financial advisor before making investment decisions.
Also read:
















