PAXG Gives 100X Return This Year? Must See! PAX Gold Price Prediction


The PAXG token is backed by one fine troy ounce of real physical gold sitting in a vault, so you get gold's steady reputation with the speed of holding a token.
That mix is exactly why traders pile in when gold-backed tokens start moving.
This PAX Gold Price Prediction looks at PAXG right after a fresh rally off its lows, now holding near recent highs and building up for its next move.
Momentum has clearly shifted, and anyone watching gold right now doesn't want to miss what happens next.
Market data was checked on August 17, 2026, at 11:44 IST.
PAX Gold Price Prediction Today: Market Overview
Metric | Value |
Price | $4,389.34 |
24h Change | +0.45% |
Market Cap | $1.91B |
24h Volume | $79.16M |
Vol/Mkt Cap (24h) | 4.08% |
FDV | $1.91B |
Liquidity/Mkt Cap | 1.02% |
Total Supply | 436.94K $PAXG |
Max Supply | ∞ (uncapped) |
Circulating Supply | 436.94K $PAXG |
Holders | 86.21K |
All-Time High | $5,622.81 (Jan 29, 2026) |
All-Time High Change | -21.93% |
All-Time Low | $1,387.98 (Oct 27, 2019) |
All-Time Low Change | +216.25% |
Source: Data from CoinMarketCap as of August 17, 2026, at 11:44 IST. Figures may vary slightly across other tracking websites.
PAXG Holder Distribution: What the Ownership Data Shows
PAXG ownership is heavily concentrated in a small number of large wallets.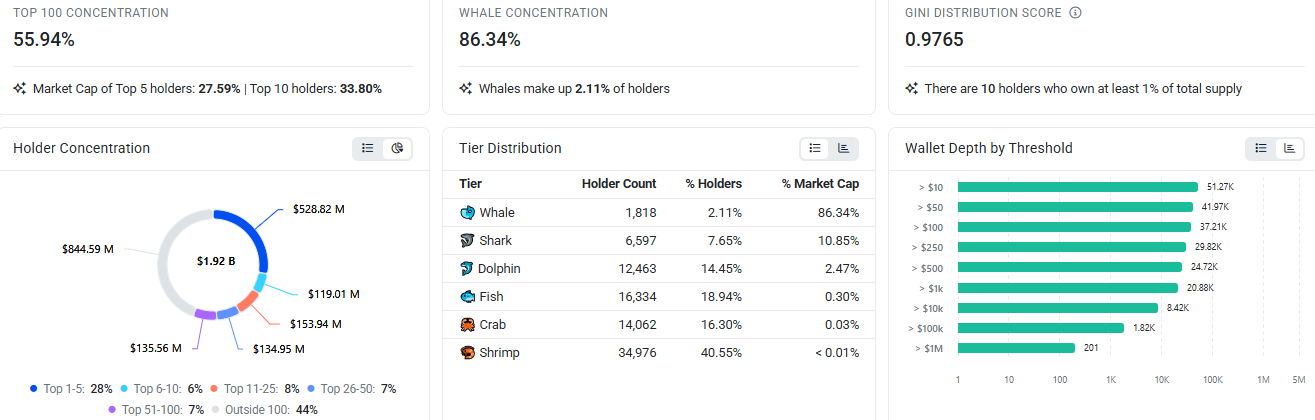
The top 100 holders control 55.94% of the total supply, and whales alone, just 2.11% of all holders, hold 86.34% of it.
The Gini score of 0.9765 confirms this: a score that close to 1 means ownership is extremely lopsided, and just 10 wallets each hold at least 1% of the entire supply.
Holder Tier | Holder Count | % of Holders | % of Market Cap |
Whale | 1,818 | 2.11% | 86.34% |
Shark | 6,597 | 7.65% | 10.85% |
Dolphin | 12,463 | 14.45% | 2.47% |
Fish | 16,334 | 18.94% | 0.30% |
Crab | 14,062 | 16.30% | 0.03% |
Shrimp | 34,976 | 40.55% | <0.01% |
In plain terms: most of PAXG's value sits with a tiny group of big holders.
When wallets that size decide to buy or sell, it can move the price a lot more than an average holder's trade would.
Worth keeping in mind when reading into any short-term price swing.
PAXG Price Prediction Chart: Technical Analysis
Pair: PAXG/USD · Market: Spot (Crypto) · Timeframe: 1D · Source: TradingView · Timestamp: August 17, 2026, 11:44 UTC+5:30
PAXG is trading at $4,389.34. The chart marks a bullish EMA crossover right where that rally started, with the EMA 20 crossing above the EMA 50, a sign that short-term momentum flipped from falling to rising.
Since then, the price has climbed into a tight consolidation range between $4,316.99 and $4,451.89, basically pausing to catch its breath after the move.
Right now PAXG is sitting inside that range, and the next real signal is which side it breaks.
A move above $4,451.89 opens the door higher, while a move below $4,316.99 would put the recent rally back in question.
Both EMA lines, at $4,278.58 and $4,215.52, sit well below the current price, backing up the bullish shift.
The RSI (Relative Strength Index, a momentum indicator that measures how fast and how far price has moved) is at 65.57 on the daily chart, above the midline but still under the 80 overbought mark, which points to solid bullish momentum without PAXG being stretched too far yet.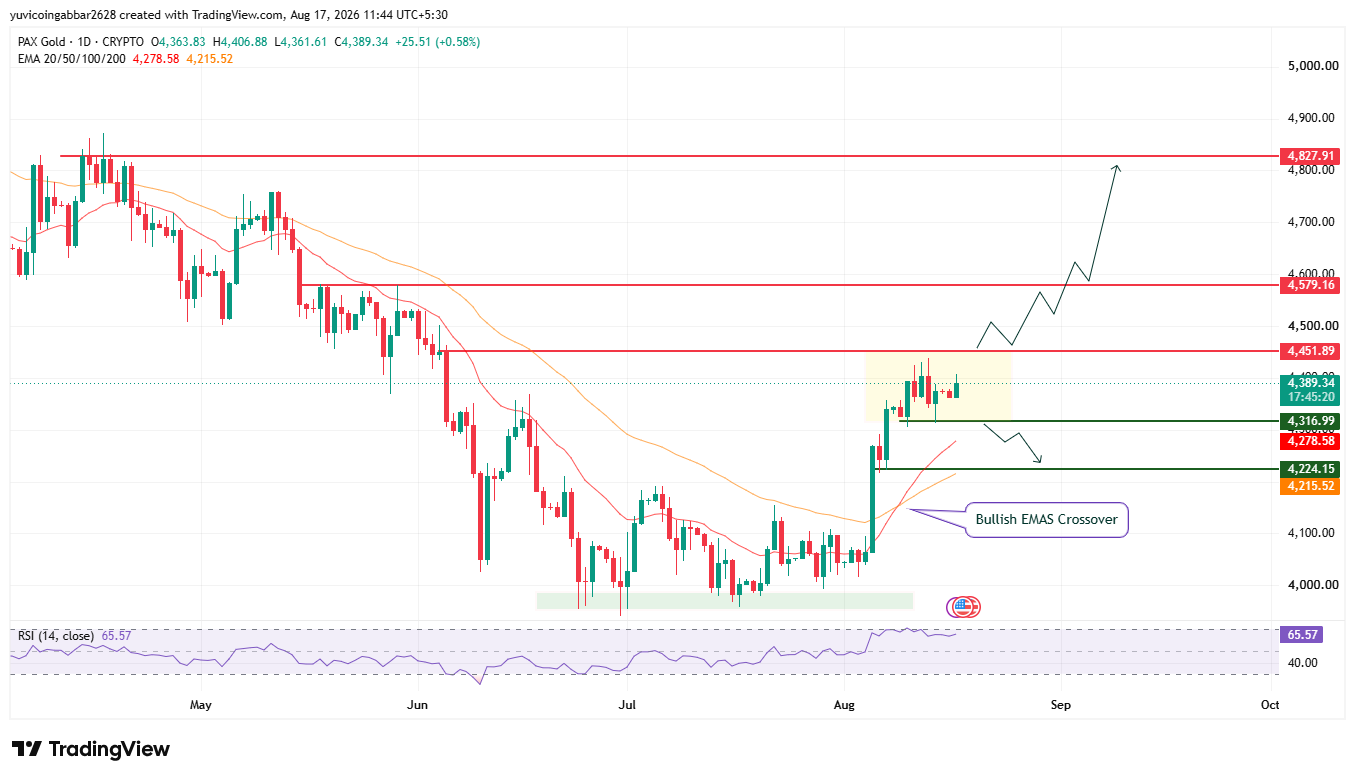
Support and Resistance Levels
Level Type | Price |
Resistance 3 | $4,827.91 |
Resistance 2 | $4,579.16 |
Resistance 1 (consolidation top) | $4,451.89 |
Immediate Price Reference | $4,389.34 |
First Support (consolidation bottom) | $4,316.99 |
Deeper Support | $4,224.15 |
EMA Levels
EMA | Price |
EMA 20 | $4,278.58 |
EMA 50 | $4,215.52 |
RSI (14) | 65.57 |
PAX Gold Forecast: Bull Case vs. Bear Case
$PAXG price target 2026 Bull case: The bullish EMA crossover and the climb into this consolidation range both point to buyers being in control.
A confirmed break above $4,451.89 would clear the current range and open the path toward $4,579.16, with $4,827.91 as the next major level after that.
$PAXG price target 2026 Bear case: Consolidation after a sharp rally can go either way, and a failure to clear $4,451.89 followed by a break below $4,316.99 would suggest the rally is running out of steam.
Losing that level would expose $4,224.15 as the next downside test.
$PAXG Price Scenarios: Triggers and Invalidation
Scenario | Trigger | Likely Outcome | Invalidation Point |
Trendline reclaim | PAXG closes above $4,451.89 | Breakout continuation toward $4,579.16 | Rejection at $4,451.89 |
Channel hold | Price stays above $4,316.99 & $4,451.89 | Consolidation continues before the next move. | Close below $4,316.99 |
Channel breakdown | Price closes below $4,316.99 | Drop toward the $4,224.15 support. | Reclaim of $4,316.99 |
$PAXG Price Target: Can $PAXG Reach $4,827.91?
$4,827.91 is the highest resistance level marked on the chart. Getting there would require PAXG to first clear $4,451.89 at the top of the current range, then push through $4,579.16 above that.
It's a multi-step move rather than a single breakout candle, but the bullish EMA crossover gives the setup a real shot at it.
What Could Invalidate the Bullish Setup?
A rejection at $4,451.89 followed by a close back below the consolidation range at $4,316.99 would put the rally in question.
A further break below $4,224.15 would undermine the bullish EMA crossover altogether and suggest the move higher has run out.
PAX Gold Price Prediction: Expert View
According to CoinGabbar analysts, The bullish EMA crossover on the daily chart lines up with the sharp rally $PAXG has had since early August, and the current consolidation looks more like a pause than a reversal so far.
That said, this range can resolve in either direction, and $4,451.89 is the level that decides it. Clear that and $4,579.16 comes into view fast.
Fail there and slip back under $4,316.99, and the rally's strength gets called into question.
Worth remembering too that $PAXG ownership is heavily concentrated among whale wallets, so any large holder's move could add extra swing to whichever direction this range breaks.
Disclaimer: This piece is for informational purposes only and isn't financial advice. The levels and scenarios above are based on technical chart analysis and publicly available data at the time of writing, and crypto markets can move sharply within hours, so past patterns don't guarantee future outcomes. It's worth doing independent research and considering your own risk tolerance before acting on any of the levels discussed here.
Also read:













.webp)








