PAX Gold Price Prediction: Can NFP Day Explode Gold Price Today?


Gold traders have one thing marked on the calendar today: Non-Farm Payrolls. Jobs data has a habit of shaking markets in minutes, and $PAX Gold, which tracks the metal, is sitting right at a level where that kind of move could matter a lot.
This PAX Gold price prediction 2026 looks at where PAXG stands heading into the numbers and what could happen once they land.
Market data checked on September 4, 2026, at 8:19 AM (UTC-3).
PAX Gold Price Prediction Today: Market Overview
Metric | Value |
Price | $4,469.46 |
24h Change | +0.60% |
Market Cap | $1.93B |
FDV | $1.93B |
24h Volume | $204.29M |
Vol/Mkt Cap (24h) | 10.57% |
Liq/Mkt Cap | 1.04% |
Total Supply | 432.1K PAXG |
Max Supply | Uncapped |
Circulating Supply | 432.1K PAXG |
Holders | 86.56K |
Source: Data from CoinMarketCap as of September 4, 2026, at 5:59 pm . Figures may vary slightly across other tracking websites.
What's Coming Today: US Non-Farm Payrolls Could Move $PAX Gold
Today's economic calendar has a few releases that could shake $PAX Gold and PAXG. At 6:00 PM, Canada reports its Employment Change, forecast at 15.1K versus 75.1K previously, alongside a steady 6.4% unemployment rate.
On the US side, Average Hourly Earnings are expected to rise 0.3% month over month, up from 0.1% previously, while Non-Farm Payrolls are forecast to add 55K jobs, a sharp swing from the prior reading of -23K.
The US unemployment rate is expected to hold at 4.1%.
A weaker-than-expected NFP print typically supports it on rate-cut hopes, while a stronger print could pressure it.
PAXG Liquidation and Volume Snapshot
Source: Data From CoinGlass
Liquidations (Coinglass, Futures)
Timeframe | Total Liquidations | Long | Short |
12H | $827.49 | $174.17 | $653.32 |
24H | $40.15K | $17.62K | $22.53K |
Exchange Volume Breakdown (Coinglass, Futures)
Exchange | 24h Futures Volume |
Binance | $116.68M |
WhiteBIT | $30.27M |
Combined futures volume tops $172M across these exchanges, led by Binance.
Why This Data Matters for Gold Price Today
Jobs data drives Fed rate expectations, and rate expectations drive $PAX Gold.
A weak labor market makes rate cuts more likely, which tends to push investors toward $PAXG since it doesn't pay interest and looks more attractive when rates fall.
A strong jobs report does the opposite, often pressuring it as investors expect rates to stay higher for longer. That's why a single data release like this can move $PAXG more in a few minutes than a normal trading day.
PAXG Price Prediction Chart: Technical Analysis
Pair: PAXG/USD · Market: Spot (Crypto, aggregated) · Timeframe: 1D · Source: TradingView · Timestamp: September 4, 2026, 08:19 UTC-3
PAXG trades at $4,469.46, ascending channel that carried the price from the $4,205 area in early August toward a high near $4,700.
Price is now holding between the EMA cluster below and the $4,512.70 resistance above, with EMA 20 at $4,453.76 and EMA 50 at $4,362.87 sitting close to the current price.
The key will be whether the price consolidates or breaks above the current key levels.
Quick take: PAXG stays constructive above $4,362.87, with a close above $4,512.70 opening the path toward $4,674.23. A break below $4,362.87 would put this setup in question.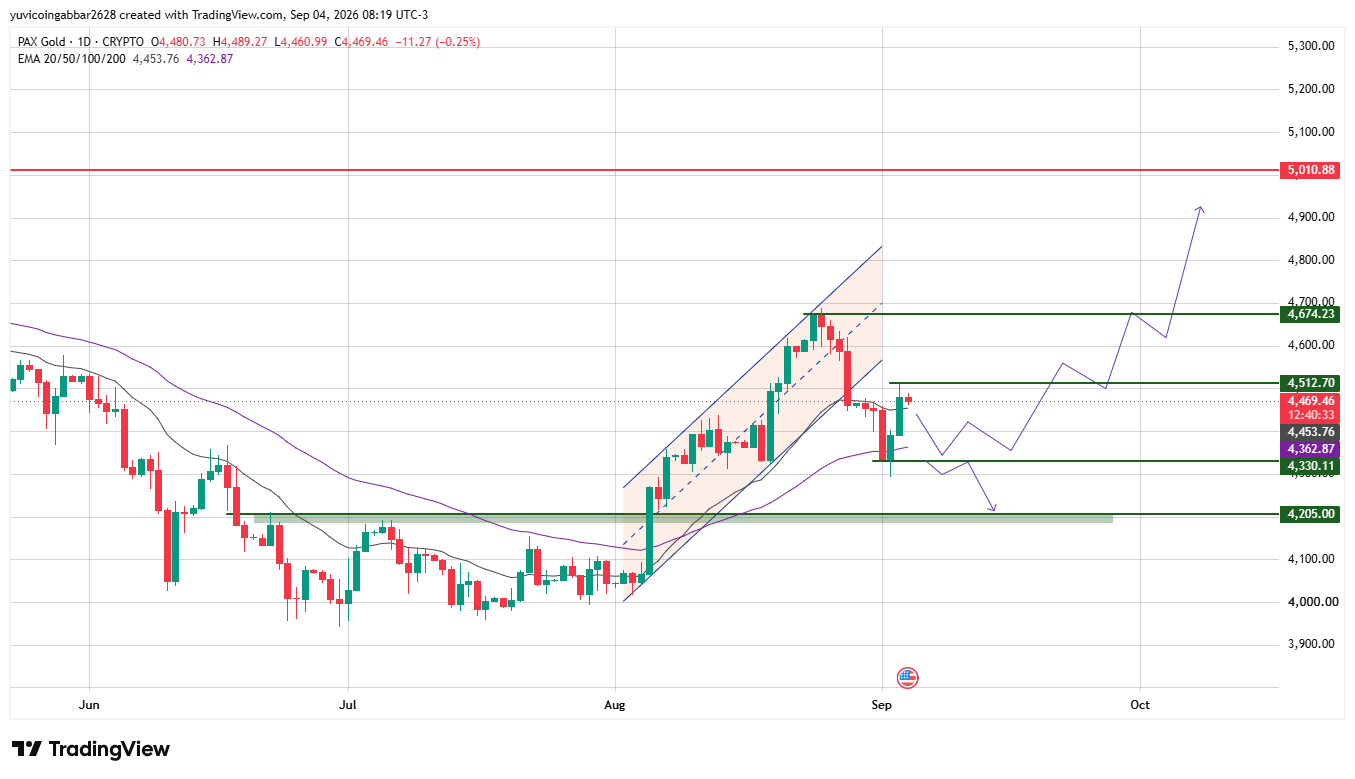
Gold Price Outlook: key Levels
Level Type | Price |
Resistance 3 | $5,010.88 |
Resistance 2 | $4,674.23 |
Resistance 1 (nearest) | $4,512.70 |
Immediate Price Reference | $4,469.46 |
First Confirmed Support | $4,330.11 |
Deeper Support | $4,205.00 |
PAX Gold Forecast: Bull Case vs Bear Case
Bull case: Holding above the EMA cluster near $4,362.87 to $4,453.76 keeps the structure intact. A confirmed close above $4,512.70 would open the path toward $4,674.23, with $5,010.88 in view further out.
Bear case: A break below $4,330.11 would expose the deeper support at $4,205.00, and a soft NFP-driven reaction could accelerate either move given today's data.
Can $PAXG Reach $5,010.88?
$5,010.88 is the highest resistance level marked on the $PAXG chart.
Reaching it would require a price to first reclaim $4,512.70, then clear $4,674.23, a multi-stage move rather than a single leg.
PAX Gold Price Prediction 2026: Expert View
According to CoinGabbar analysts, $PAXG is consolidating right into a Non-Farm Payrolls release, which tends to add short-term volatility regardless of the trend.
$4,330.11 is the level that keeps the structure intact, with $4,512.70 the next real test once the dust settles.
A weak jobs print would likely favor $PAXG; a strong one could pressure it toward support.
Disclaimer
This article is for informational purposes only and does not count as financial advice. The levels and scenarios discussed above come from technical chart analysis and publicly available data at the time of writing, and crypto prices can shift quickly, especially around major economic data releases, so historical patterns do not guarantee what happens next. Readers should do their own research and weigh their own risk tolerance before making any decisions based on the levels covered here.
















