PAX Gold Price Prediction: $18B Gold ETF Inflows Fuel $PAXG $5k?


Gold just got a very bullish call. Analysts now measure a fair value near $5,025 an ounce, roughly 9% above where $gold trades today, and money is already flowing in, with gold ETFs pulling in the biggest 12-month haul since February.
$PAX Gold tracks that same metal, and after a sharp pullback from its recent highs, this PAX Gold Price Prediction looks at whether PAXG is setting up for its next leg higher.
Market data was checked on September 2, 2026, at 3:16 PM IST.
PAXG Price Prediction: Market Overview
| Metric | Value |
| Price | $4,318.11 |
| 24h Change | -1.50% |
| Market Cap | $1.86B |
| FDV | $1.86B |
| 24h Volume | $297.19M |
| Vol/Mkt Cap (24h) | 15.97% |
| Liq/Mkt Cap | 1.14% |
| Total Supply | 431.31K $PAXG |
| Max Supply | Uncapped |
| Circulating Supply | 431.31K $PAXG |
| Holders | 86.45K |
Source: Data from CoinMarketCap as of September 2, 2026, at 3:16 PM IST. Figures may vary slightly across other tracking websites.
Gold Price Prediction 2026: Fair Value Seen Near $5,025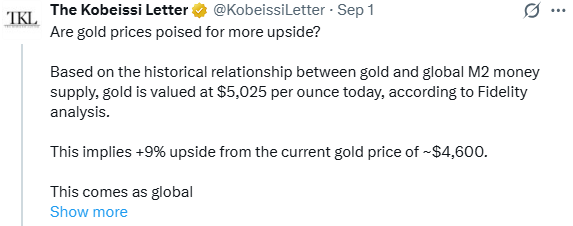
Source: Data From X
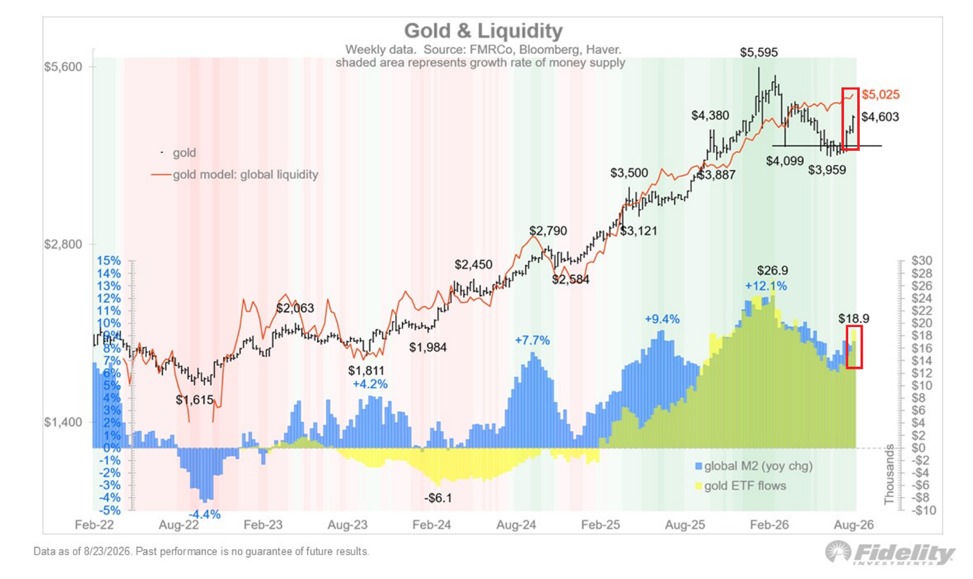
A post from The Kobeissi Letter cited Fidelity analysis putting $gold's fair value near $5,025 an ounce, based on its historical relationship with global M2 money supply, about 9% above $gold's recent price near $4,600.
The post also flagged M2 growth accelerating to roughly 8.5% year over year and $gold ETF inflows reaching $18.9 billion over the past 12 months, the strongest pace since February.
CoinGabbar could not independently verify these figures beyond what was shared in the post.
PAX Gold Liquidation and Volume Snapshot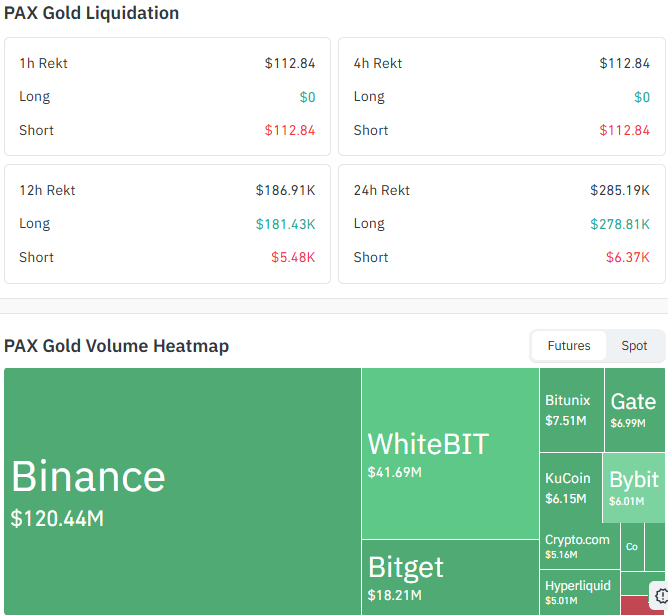
Source: Data From CoinGlass
Liquidations (Coinglass, Futures)
| Timeframe | Total Liquidations | Long | Short |
| 1H | $112.84 | $0 | $112.84 |
| 4H | $112.84 | $0 | $112.84 |
| 12H | $186.91K | $181.43K | $5.48K |
| 24H | $285.19K | $278.81K | $6.37K |
Longs took the bigger hit over the 12H and 24H windows as PAXG sold off from its recent highs.
Exchange Volume Breakdown (Coinglass, Futures)
| Exchange | 24h Futures Volume |
| Binance | $120.44M |
| WhiteBIT | $41.69M |
Combined futures volume across these exchanges tops $217M, led by Binance.
PAXG Price Prediction Chart: Technical Analysis
Pair: PAXG/USD · Market: Spot (Crypto, aggregated) · Timeframe: 1D · Source: TradingView · Timestamp: September 2, 2026, 15:16 UTC+5:30
PAX Gold trades at $4,318.11, after a sharp pullback from the ascending channel it had been climbing since early August.
Price rallied inside that channel to a high near $4,673.39 before reversing, breaking below both the channel's lower boundary and the $4,449.73 support line.
PAXG is now testing the EMA 20 at $4,442.08 from below, with the EMA 50 at $4,350.64 close behind, and the next support band sitting at $4,205.00.
The important thing is that the price is pulling back to the current support level of $4,205.
If it holds that level, it will continue the uptrend and can push toward a new high. 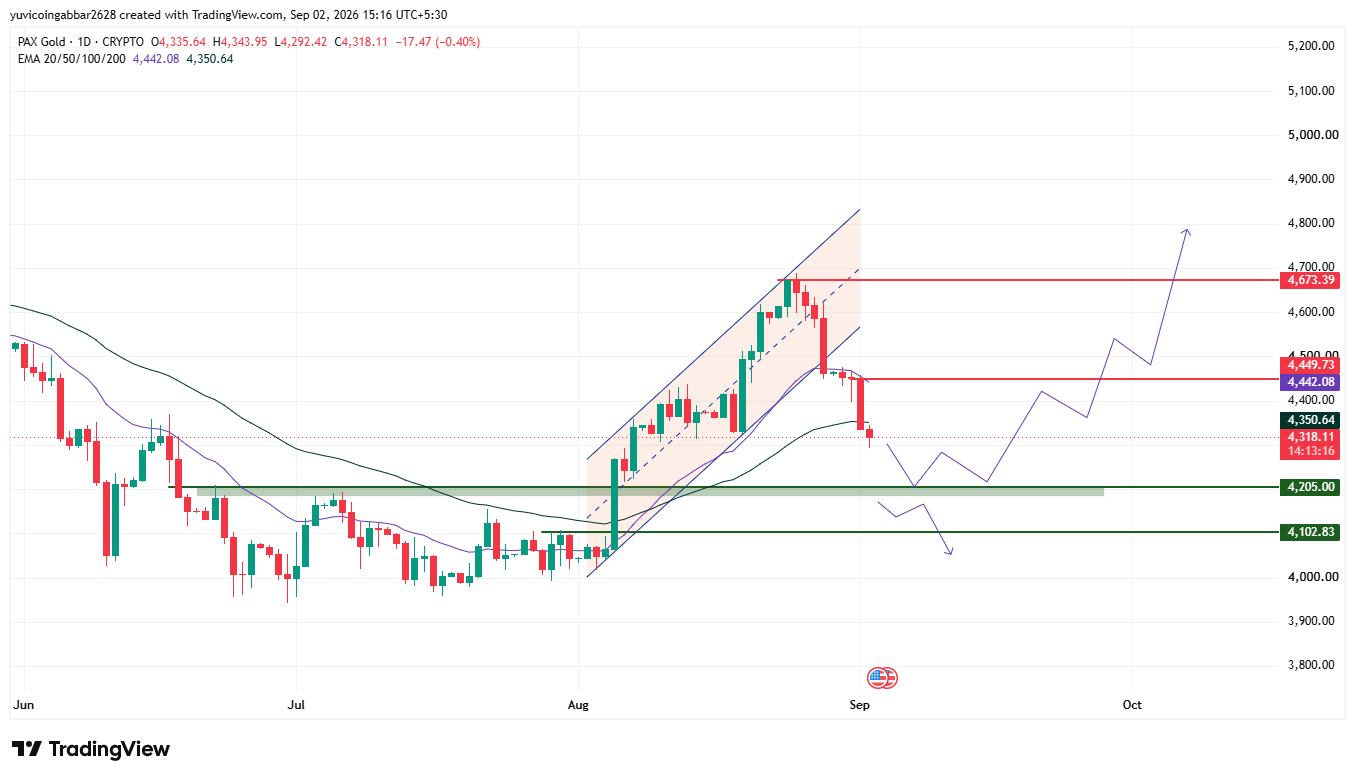
PAX Gold Price Prediction 2026: Key Levels
| Level Type | Price |
| Resistance 2 | $4,673.39 |
| Resistance 1 (nearest) | $4,449.73 |
| Immediate Price Reference | $4,318.11 |
| First Support | $4,205.00 |
| Deeper Support | $4,102.83 |
PAX $Gold Forecast 2026: Bull Case vs Bear Case
Bull case: Holding above the $4,205.00 support band keeps the uptrend intact.
A reclaim of the EMA cluster near $4,350.64 to $4,442.08 would open the path back toward $4,449.73 and $4,673.39.
Bear case: A break below $4,205.00 would expose the deeper support at $4,102.83, and a close below that would put the channel breakout in question.
PAXG Price Scenarios: Triggers and Invalidation
| Scenario | Trigger | Likely Outcome | Invalidation Point |
| Pullback continuation | Daily close below $4,205.00 | Move toward $4,102.83 | Reclaim of $4,205.00 |
| Support hold | Price holds between $4,102.83 and $4,442.08 | Consolidation before the next move | Break outside either boundary |
| Recovery | Reclaim of EMA cluster ($4,350.64 to $4,442.08) | Retest of $4,449.73 and $4,673.39 | Daily close back below $4,205.00 |
Can PAX $Gold Reach $4,673.39 Again?
$4,673.39 is the highest resistance level marked on the PAXG chart; the top of the ascending channel PAXG rallied within through August.
Getting back there would require the price to first reclaim the EMA cluster near $4,350.64 to $4,442.08, then clear the $4,449.73 level that capped the recent bounce attempt.
PAXG Price Prediction 2027
By 2027, Pax $Gold could be at the first major level at $5,010.88.
This level has already capped price once earlier in the chart, so a confirmed break and hold above it would be needed to validate the move.
PAXG Price Prediction 2028
Looking further out to 2028, the next level in play is $5,631.12.
Reaching this level would require PAXG to first clear $5,010.88 and hold above it, making this a longer-term target rather than a near-term move.
PAX Gold Price Prediction: Expert View
According to CoinGabbar analysts , PAXG's pullback from the top of its channel looks like a stretched move cooling off rather than a trend change, especially with $gold's own macro backdrop staying constructive.
$4,205.00 is the level that decides whether this stays a normal pullback.
A reclaim of the EMA cluster near $4,350 to $4,442 would be the first sign buyers are stepping back in.
Disclaimer
This article is for informational purposes only and does not count as financial advice. The levels and scenarios discussed above come from technical chart analysis and publicly available data at the time of writing, and gold and crypto prices can shift quickly, so historical patterns do not guarantee what happens next. Readers should do their own research and weigh their own risk tolerance before making any decisions based on the levels covered here.
Also read:
















