PAX Gold Price Prediction 2027: $PAXG Support After Profit-Taking Dip?


$PAXG is heating up right now, and traders don't want to miss the next move.
This PAX Gold price prediction looks at whether PAXG holds here or falls further, with the bullish case staying alive above $4,330 over the next few sessions, while a break below that level opens the door to more downside.
Here's what the numbers show right now.
Market data was checked on August 31, 2026, at 09:42 IST.
PAX Gold Price Prediction Today: Market Overview
Metric | Value |
Price | $4,417.09 |
24h Change | -1.01% |
Market Cap | $1.9B (-0.98%) |
FDV | $1.9B |
24h Volume | $145M+ (up 187.07%) |
Vol/Mkt Cap (24h) | 7.66% |
Liquidity/Mkt Cap | 1.13% |
Total Supply | 431.31K PAXG |
Max Supply | Unlimited |
Circulating Supply | 431.31K PAXG |
Holders | 86.28K |
Source: Data from CoinMarketCap as of August 31, 2026, at 09:42 IST. Figures may vary slightly across other tracking websites.
Why Is PAXG Price Down Today?
PAXG tracks spot $gold, and gold has pulled back from its late-August highs as traders lock in profits after a strong rally.
That profit-taking is showing up in PAXG too, alongside a wave of long-side liquidations on futures.
PAXG Liquidation and Volume Data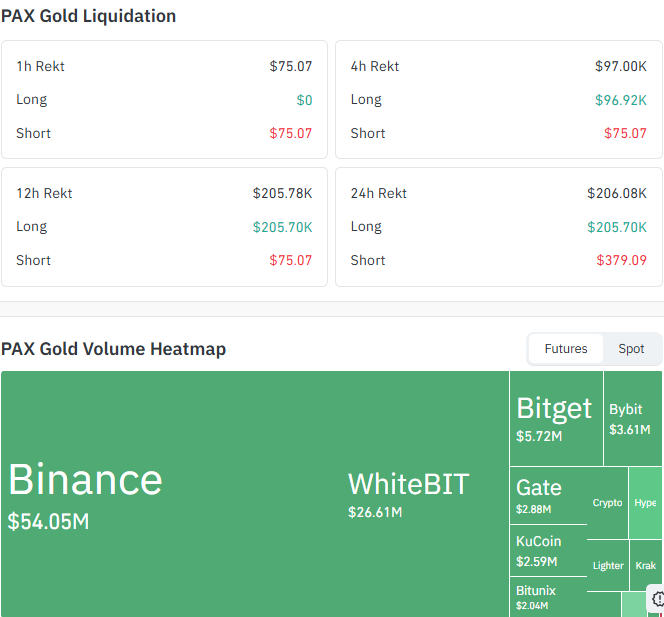
Window | Total Rekt | Long | Short |
1h | $75.07 | $0 | $75.07 |
4h | $97.00K | $96.92K | $75.07 |
12h | $205.78K | $205.70K | $75.07 |
24h | $206.08K | $205.70K | $379.09 |
This is Coinglass futures data, kept separate from the spot volume above.
Almost every dollar liquidated over the past 12 to 24 hours came from long positions, showing leveraged buyers got caught out as gold's rally cooled.
On the futures volume side, Binance leads by a wide margin at $54.05M, followed by WhiteBIT at $26.61M, Bitget at $5.72M, Bybit at $3.61M, Gate at $2.88M, KuCoin at $2.59M, and Bitunix at $2.04M.
PAXG Price Prediction Chart: Technical Analysis
Pair: PAXG/USD · Market: Spot (Crypto) · Timeframe: 1D · Source: TradingView · Timestamp: August 31, 2026, 09:42 UTC+5:30
PAXG is trading at $4,417.09, sitting right on the rising trendline that has held as support since the August lows.
Price rallied hard through August, tagging highs near the $4,584.35 zone before rolling over into the current pullback.
The EMA 9 sits at $4,497.72, above the current price, and now acts as the first hurdle on any bounce attempt.
The trend remains negative while the price trades below the trendline and EMA levels.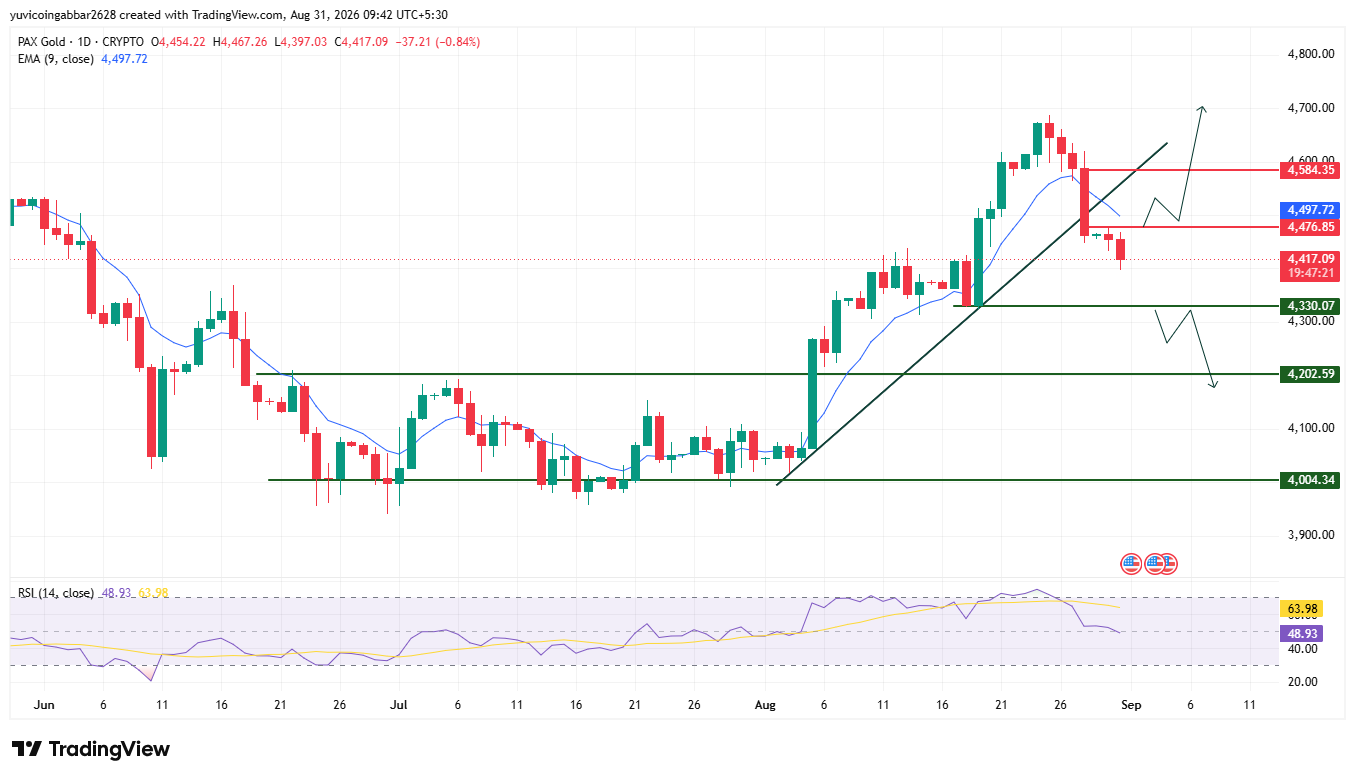
PAX Gold Price Prediction: Key Levels
Level Type | Price |
Resistance 2 | $4,584.35 |
Resistance 1 (nearest) | $4,476.85 |
Immediate Price Reference | $4,417.09 |
First Confirmed Support (trendline zone) | $4,330.07 |
Deeper Support | $4,202.59 |
Structural Floor | $4,004.34 |
PAX Gold Forecast: Bull, Base, and Bear Case
Bull case: A daily close back above $4,476.85 would confirm the trendline is holding rather than breaking, opening a path toward the EMA 9 at $4,497.72 and then $4,584.35 if buying interest returns.
Base case: $PAXG consolidates between the trendline support at $4,330.07 and resistance at $4,476.85, digesting the recent rally before its next real move, with liquidations and volume staying relatively light.
Bear case: Losing $4,330.07 would put the trendline support in doubt and suggest the pullback has further to run, exposing $4,202.59 and then the structural floor near $4,004.34.
$PAXG Price Scenarios: What to Know
Scenario | Trigger | Likely Outcome | Invalidation Point |
Trendline hold (bullish) | Daily close above $4,476.85 | Move toward $4,497.72, then $4,584.35 | Close back below $4,330.07 |
Range-bound | Price holds between $4,330.07 and $4,476.85 | Sideways chop, no clear trend | Break of either boundary |
Trendline break (bearish) | Daily close below $4,330.07 | Drop toward $4,202.59, then $4,004.34 | Reclaim above $4,330.07 |
Can $PAXG Reach $4,584.35?
$4,584.35 is the highest resistance marked on the chart. Getting there would need PAXG to first clear the EMA 9 at $4,497.72 and hold the $4,476.85 zone, a two-step move rather than a single leg, especially with $gold-wide profit-taking still in play.
PAX Gold Price Prediction 2027: Key Levels
Level Type | Price |
Major Resistance | $5,605.90 |
Resistance | $5,197.35 |
Resistance | $4,803.36 |
Current Price | $4,420.10 |
Support | $4,330.07 |
Major Support | $4,202.59 |
PAX Gold Price Prediction: Expert View
According to CoinGabbar analysts, $PAXG's pullback tracks the broader $gold market cooling off after a strong August rally, not any change in the bigger trend, and the heavy long-side liquidations point to leveraged positioning taking the brunt of the move.
The $4,330.07 to $4,476.85 zone is the one to watch: holding the trendline keeps the setup intact; losing it points to a deeper correction first.
PAX Gold Price Prediction: Data Sources
Price and EMA data referenced from a 1D PAXG/USD chart via TradingView, timestamped August 31, 2026, 09:42 UTC+5:30. Market cap, FDV, volume, and supply data referenced from a market tracker snapshot. Liquidation and futures volume data referenced from Coinglass.
Disclaimer
This piece is for informational purposes only and isn't financial advice. The levels and scenarios above are based on technical chart analysis and publicly available data at the time of writing, and crypto and gold markets can move sharply within hours, so past patterns don't guarantee future outcomes. It's worth doing independent research and considering your own risk tolerance before acting on any of the levels discussed here.
Also read:
















