PAX Gold Price Prediction: What PAXG's Pullback Signals Next


PAX Gold (PAXG) is pulling back after a strong multi-week advance, and the retreat is prompting fresh questions about where the gold-backed token heads next.
PAXG is trading near $4,458, down about 3.1% over the past 24 hours, following a rally that carried the token from a summer consolidation zone to levels above $4,800.
This PAX Gold price prediction looks at what the pullback means for the token's near-term structure, using data through August 29, 2026.
Derivatives Desk: Positioning Stays Long-Biased
According to CoinGlass data, PAXG's open interest stands at $208.85M as of August 29, 2026, holding within the broader downtrend the metric has followed since April, even as recent sessions show a modest uptick.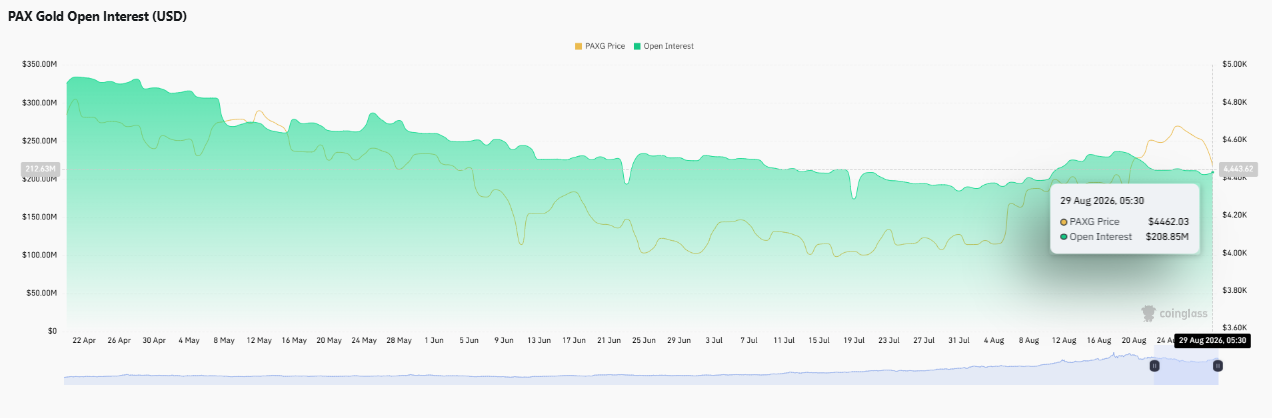
Binance's PAXG/USDT long/short ratio reads 1.767 among all accounts and climbs to 2.9349 among top trader positions, pointing to a persistent long bias.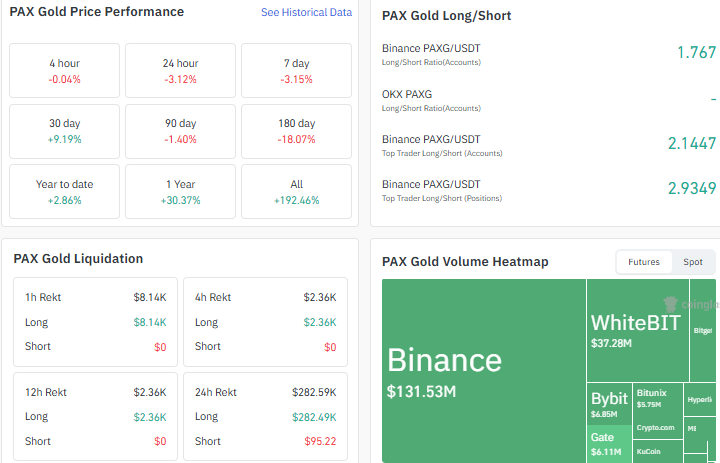
Liquidations remain thin and one-sided: the past 24 hours saw $282.59K wiped out, almost entirely from long positions at $282.49K.
Binance leads futures volume by a wide margin at $131.53M, followed by WhiteBIT at $37.28M.
On performance, PAXG is up 9.19% over 30 days and 30.37% over the past year, though it remains down 18.07% across the last 180 days.
Market Cap & Network Metrics
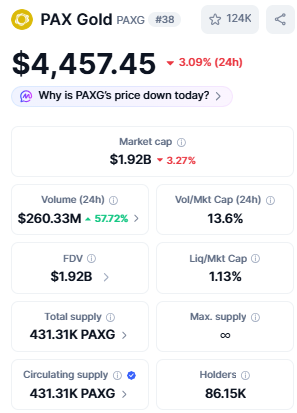
As per CoinMarketCap data, PAX Gold carries a market cap of around $1.92B against a circulating supply of 431,310 PAXG, with each token backed by physical gold.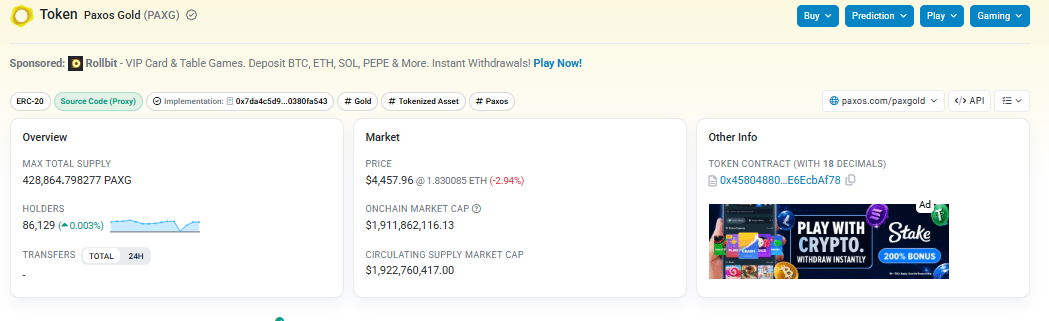
24-hour trading volume has climbed to $260.33M, up 57.72%, pushing the volume-to-market-cap ratio to 13.6%.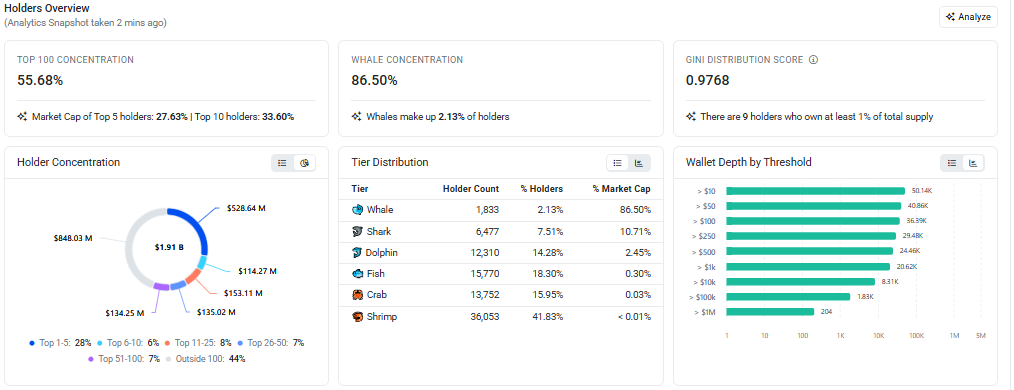
On-chain data shows holders near 86,129, with the top 100 wallets controlling just over 55% of the supply, a moderate concentration for a PAX Gold price prediction compared to typical altcoins.
Bull, Bear, and Neutral Signals for PAXG
Signal | What It Shows |
Bullish | Long/short ratio leaning long across accounts and top traders; 30-day and 1-year returns positive |
Bearish | Price down over 3% in 24 hours, pulling back toward its recent trend line |
Neutral | RSI near 52, a balanced reading with no extreme signal either way |
Technical Chart Read: PAXG's Daily Structure
As per the TradingView chart, PAXG spent several weeks consolidating through June and July before a strong move pushed it past $4,321, followed by a run of higher highs and higher lows into August.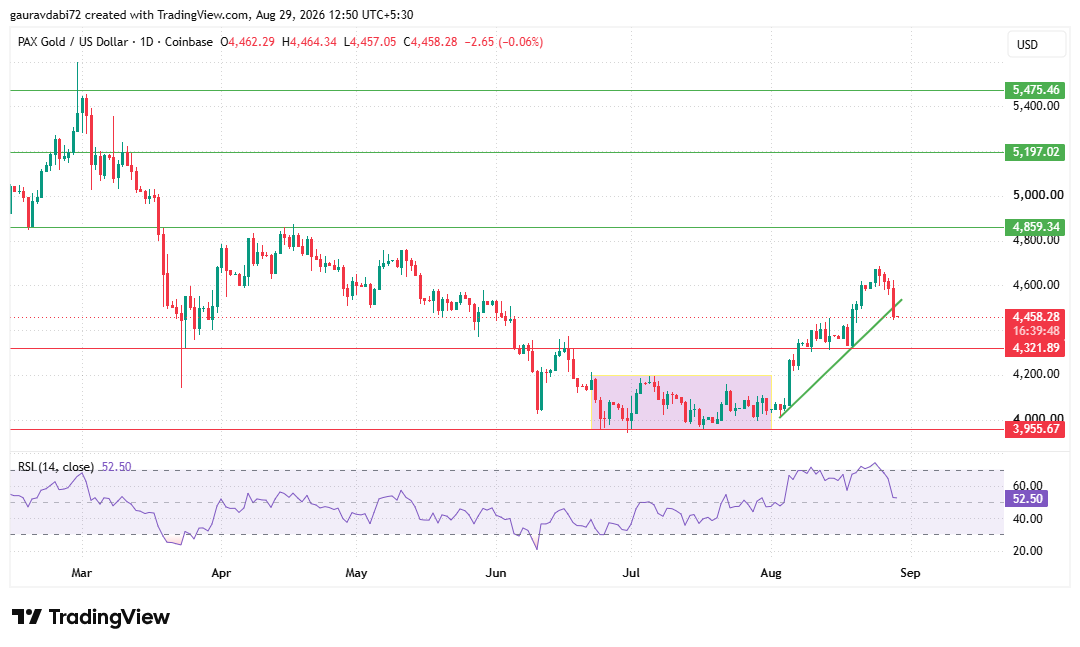
That structure is now cooling, with the price slipping back toward its recent trendline in what looks like an early-stage pullback.
The next levels PAXG can go toward on the downside are $4,321.89, followed by $3,955.67, the zone where the earlier consolidation held.
On the upside, a resumption of the uptrend would put $4,859.34, $5,197.02, and $5,475.46 back in view.
The daily RSI (14) reads 52.50, a fairly neutral level that doesn't point strongly toward either overbought or oversold conditions.
CoinGabbar Analyst Desk View
According to the CoinGabbar analyst desk, PAXG's pullback from recent highs looks more like a structural retest than a reversal of the broader uptrend that has held since summer, especially with long positioning still dominant across major derivatives venues.
That said, a daily close below $4,321.89 would put the case for a deeper move toward $3,955.67 back on the table.
Anyone following this PAX Gold price prediction will want to watch whether the current trendline holds over the next few sessions.
Disclaimer: This article is for informational purposes only and should not be considered financial or investment advice. Cryptocurrency markets are highly volatile; readers are advised to do their own research before making any decisions.

















