PAX Gold Price Prediction: PAXG Short-Term Entry Levels, Next Rally?


Gold-backed PAXG is holding steady near record highs, consolidating tightly after a sharp climb, while whale concentration data raises fresh questions about who really controls the supply.
This PAX Gold Price Prediction covers what the chart pattern suggests, what the liquidation data shows, and the levels that matter most right now.
Market data was checked on August 22, 2026, at 17:30 IST. 
PAXG Live Price and Market Stats
Metric | Value |
Price | $5,489.81 |
24h Change | +0.16% |
Market Cap | $1.98B |
24h Change (Market Cap) | -1.12% |
FDV | $1.98B |
24h Volume | $225.3M+ |
24h Change (Volume) | -29.18% |
Vol/Mkt Cap (24h) | 11.35% |
Liquidity/Mkt Cap | 1.10% |
Total Supply | 433.3K PAXG |
Max Supply | Infinite |
Circulating Supply | 433.3K PAXG |
Holders | 86.07K |
Source: Data from CoinMarketCap as of August 22, 2026, at 17:30 IST. Figures may vary slightly across other tracking websites.
PAXG Holder Concentration: A Risk Worth Watching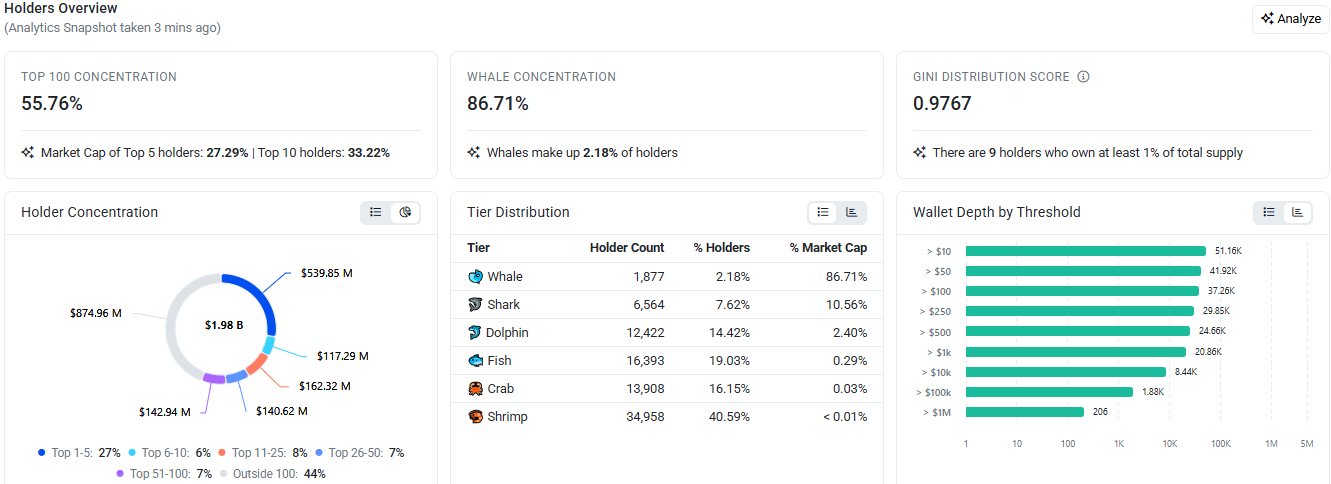
Analytics data shows the top 100 wallets hold 55.76% of PAXG's total market cap, with whales (2.18% of all holders) controlling 86.71% of that cap.
Just 9 holders each own at least 1% of total supply, and the Gini distribution score sits at 0.9767, indicating extremely high concentration.
This isn't a bearish or bullish signal on its own, but it's a structural factor worth watching, since large holder movements could add volatility beyond what gold's own price action would suggest.
PAXG Price Prediction Chart: Technical Analysis
Pair: PAXG/USD · Market: Spot (Crypto) · Timeframe: 4H · Source: TradingView · Timestamp: August 22, 2026, 16:19 UTC+5:30
PAXG rallied sharply from $4,571.45 to a recent high near $4,592.17 and is now consolidating in a tight channel pattern around $4,571.45.
The chart shows a drawn projection suggesting a potential bullish continuation toward $4,839.29 if the pattern breaks upward, though this remains a projected path, not confirmed price action yet.
RSI sits at 72.78, in overbought territory, reflecting the strength of the recent rally into this consolidation phase.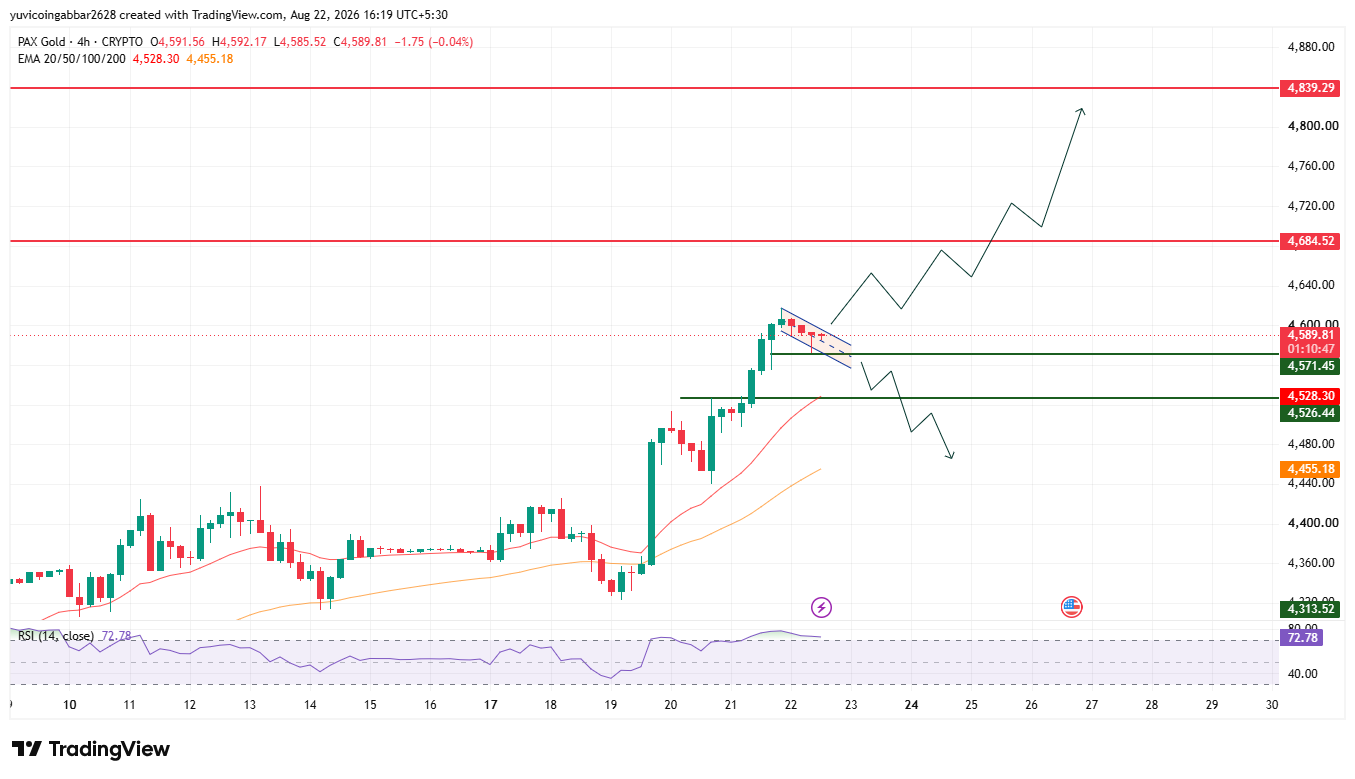
Important Key Support and Resistance Levels
Level Type | Price |
Resistance 2 | $4,839.29 |
Resistance 1 (nearest) | $4,684.52 |
Immediate Price Reference | $4,589.81 |
Resistance | $4,571.45 |
Support | $4,526.44 |
PAX Gold Liquidation and Volume Data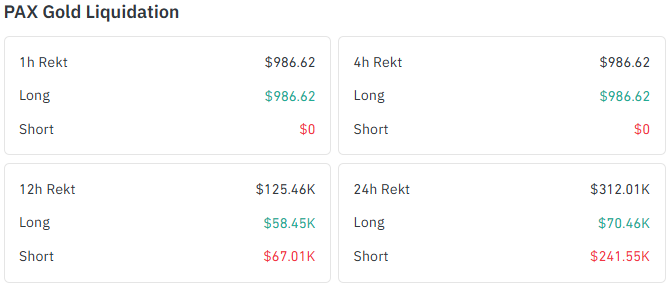
Source: Data From CoinGlass
Coinglass $data shows liquidation activity has been long-skewed and relatively light given PAXG's low-volatility profile as a gold-backed token.
Timeframe | Total Liquidated | Long Liquidations | Short Liquidations |
1h | $986.62 | $986.62 | $0 |
4h | $986.62 | $986.62 | $0 |
12h | $125.46K | $58.45K | $67.01K |
24h | $312.01K | $70.46K | $241.55K |
The 24h window flips toward short liquidations dominating, suggesting some late shorts got caught as price held up near the recent highs rather than pulling back further.
$PAXG Forecast: Bull Case vs Bear Case
$PAXG price target 2026 Bull case: Holding the channel pattern above $4,528.30 and breaking above $4,571.45 would support a move toward $4,684.52 and eventually $4,839.29, in line with the chart's projected path.
$PAXG price target 2026 Bear case: A break below $4,528.30 ema would invalidate the channel setup and could open a retest of $4,313.52.
Concentrated whale holdings add a layer of unpredictability if large wallets decide to move.
$PAXG price target: Can PAXG Reach $4,839?
$4,839.29 is the highest level marked on the projected path.
Getting there would require PAXG to clear the resistance at $4,571.45 and then $4,684.52, a two-stage move that depends on the consolidation resolving upward rather than breaking down.
PAX Gold Price Prediction: Expert View
According to CoinGabbar analysts, PAXG's tight consolidation after a strong rally often reflects healthy digestion rather than exhaustion, especially with RSI easing off extreme levels.
The whale concentration $data is the wildcard here; a token this concentrated can see outsized moves if large holders act.
The $4,528.30 to $4,571.45 range is the one to watch for direction over the next day or two.
Disclaimer: This piece is for informational purposes only and isn't financial advice. Levels and scenarios are based on technical chart analysis and public data at the time of writing; markets can move sharply within hours. It's worth doing independent research and considering your own risk tolerance before acting on any levels discussed here.
Also read:











.webp)





