PEPE Price Prediction: $PEPE Could Shock Traders With a Huge Surge


Pepe launched in 2023 as a meme coin built around the well-known internet frog, and it quickly became one of the most traded meme tokens in the market.
It's currently trading around $0.00000314, up more than 21% on the day, with a market cap of $1.321B that puts it around the 57th largest cryptocurrency.
This Pepe price prediction is built around how that retest resolves.
Live Market Data
Metric | Value |
Price | $0.00000314 |
24h Change | +21.5% |
24h Range | $0.0000025740 - $0.0000032050 |
$1.321B | |
Fully Diluted Valuation | $1.321B |
24h Trading Volume | $416.965M |
Circulating Supply | 420.69T |
Total Supply | 420.69T |
Max Supply | 420.69T |
Source: $PEPE market cap data taken from Coingecko, data as of Aug 20, 2026. Figures may vary slightly across other tracking websites.
Liquidation Snapshot
PEPE's move triggered $1.58M in total liquidations over the past 24 hours, and shorts took by far the bigger hit at $1.20M against $380.95K in long liquidations, a sign sellers got caught off guard by the bounce. 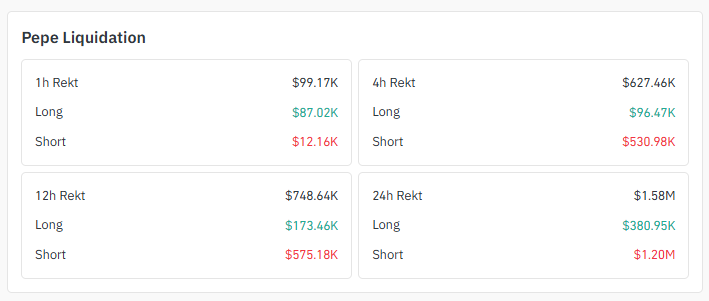
Source: Liquidation Data Taken From Coinglass.
The 12-hour window shows a similar pattern, with $575.18K in short liquidations against $173.46K in longs.
The 4-hour window leans the same way too, with $530.98K in short liquidations dwarfing $96.47K in longs.
Only the 1-hour window flips the script, with longs taking the bigger hit at $87.02K against $12.16K in shorts, hinting some fast money chasing the pump got stopped out quickly.
Exchange Volume
OKX leads PEPE futures activity with $258.66M in volume, well ahead of MEXC at $178.73M and LBank at $111.22M. 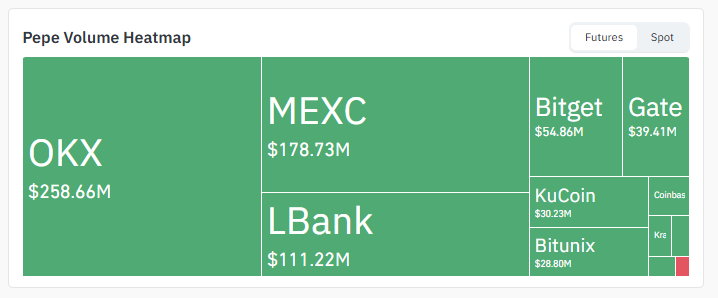
Source: Volume Heatmap Data Taken From Coinglass.
Bitget and Gate make up the next tier, while KuCoin and Bitunix contribute smaller but still meaningful slices of the total.
$PEPE News Today
Social sentiment around $PEPE has turned bullish alongside a broader crypto rally, with coverage noting that PEPE saw a push higher following Bitcoin's latest run past the $68K mark. 
Source: Data Taken From @BSCNews, X Account.
The same commentary pointed to Solana and Zcash moving in tandem, along with a wider altcoin market that includes Sui, Ondo, and Ethereum all trading in bullish mode.
That kind of broad-based strength across multiple assets tends to support continuation moves rather than isolated spikes, which lines up with the bullish tilt seen in the liquidation data for this Pepe price prediction.
Key Takeaways
PEPE has broken out of the descending channel it had been trading inside, and price is now retesting the breakout zone near $0.0000031.
Current price sits at $0.00000314, up 21.5% over the past 24 hours, inside a 24-hour range of $0.0000025740 to $0.0000032050.
Immediate resistance sits at $0.00000329. A clean move above that level opens the path toward $0.00000346 and then $0.00000383.
Support below the current zone rests at $0.00000296, with deeper floors at $0.00000277 and $0.00000263 if the retest fails.
Liquidation data shows short sellers absorbing the majority of the damage over the past 24 hours, a sign the rally caught bearish positioning off guard.
Technical Analysis
4-Hour Chart Analysis
PEPE had been grinding lower inside a descending channel on the shorter-term chart, with a falling trendline capping the price on top and a matching one below.
That channel just broke. Price pushed sharply above the upper boundary and is now sitting right at the retest zone near $0.0000031, based on TradingView data. From here, everything comes down to whether the breakout zone holds as new support. 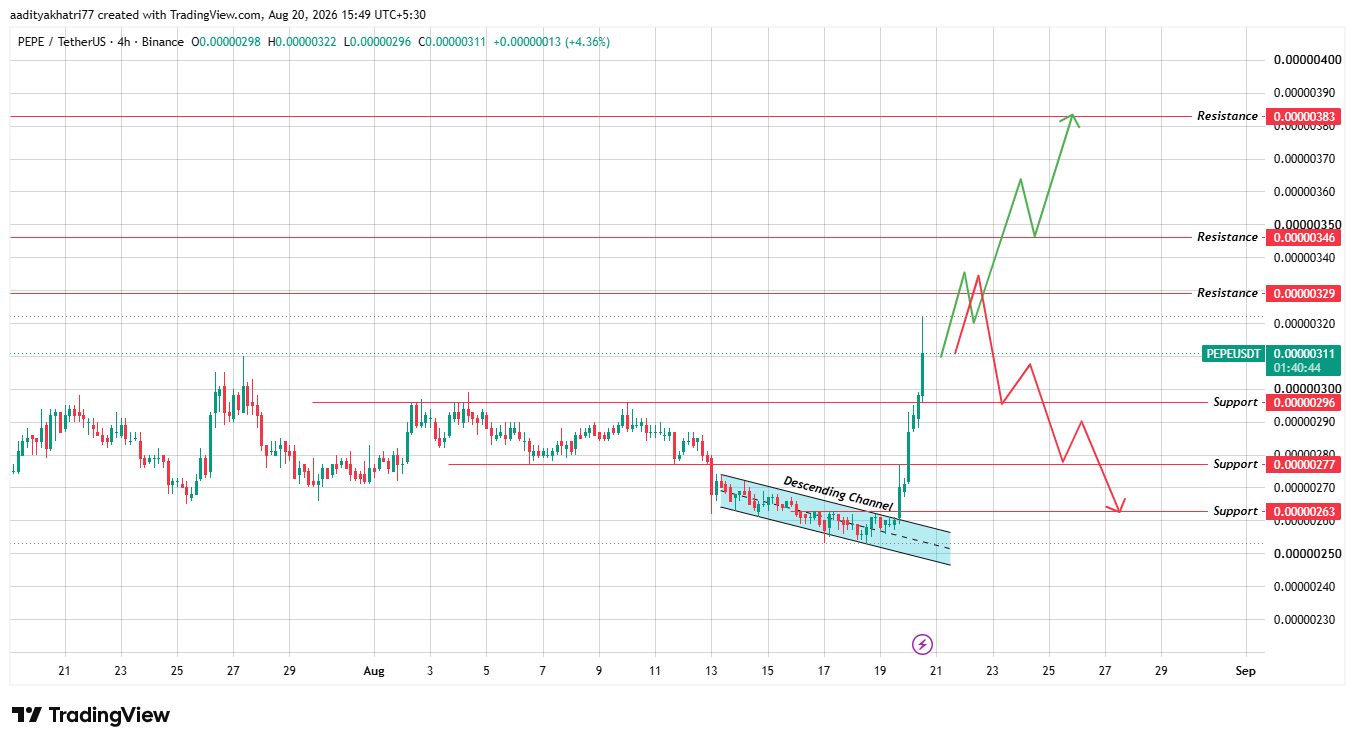
Source: Chart Taken From TradingView.
If buyers take volume here, price should push toward $0.00000329 first, then $0.00000346 and $0.00000383 further out.
A rejection at resistance combined with a failure to sustain the breakout zone instead sends price back toward $0.00000296, with $0.00000277 and $0.00000263 as the next floors if selling continues.
This is the key level to watch for this Pepe price prediction over the coming candles.
Support and Resistance Levels
Level Type | Price |
Resistance 3 | $0.00000383 |
Resistance 2 | $0.00000346 |
Resistance 1 | $0.00000329 |
Immediate Price Reference | $0.00000311 |
First Support | $0.00000296 |
Deeper Support | $0.00000277 |
Structural Floor | $0.00000263 |
These levels for this Pepe price prediction are pulled directly off the chart, from the top resistance right down to the structural floor.
Bull, Base, and Bear Case
Scenario | Price level | Invalidation |
Bull | $0.00000329 - $0.00000383 | Fails to close above $0.00000329 on strong volume |
Base | $0.00000296 - $0.00000329 | Price chops inside the retest zone without a decisive break either way. |
Bear | $0.00000277 or lower | The breakout zone at $0.00000296 gives way, and the old channel resumes |
These three scenarios anchor this Pepe price prediction, weighted by how the retest of the breakout zone plays out over the coming sessions.
Glossary
Descending Channel: A chart pattern formed by two parallel downward-sloping trendlines connecting a series of lower highs and lower lows.
Breakout: A price move above (or below) a defined chart boundary, often signaling a potential trend shift.
Retest: When the price returns to a broken support or resistance level to confirm whether it now acts as the opposite (support becomes resistance or vice versa).
Liquidation: The forced closure of a leveraged trading position when losses exceed the trader's margin.
Resistance: A price level where selling pressure has historically been strong enough to stop further upward movement.
Support: A price level where buying pressure has historically been strong enough to halt further downward movement.
Market Cap: The total value of all circulating coins, calculated as price multiplied by circulating supply.
Methodology
All price levels, support and resistance zones, and channel structures referenced in this PEPE price prediction are derived directly from the PEPE/USDT chart on TradingView, cross-checked against live market data, and Coinglass liquidation figures at the time of writing. No price levels are extrapolated beyond what the chart structure supports.
Disclaimer: This article is for informational purposes only and does not constitute financial, investment, or trading advice. Cryptocurrency markets are highly volatile, and prices can change rapidly. Always conduct your own research and consult a licensed financial advisor before making investment decisions.
Also read:







.webp)








