Pepe Price Prediction: Can PEPE Finally Break Into a New Bull Run?


PEPE has gone sideways for weeks now. Still no clear winner. That's really the whole story behind this Pepe price prediction at the moment.
Price sits right where a rising floor meets a flat ceiling on the bigger chart, and a smaller version of that same squeeze is playing out on the shorter time frame too. Push higher, and the mid $0.0000003 zone comes into view.
Drop instead, and it's back under $0.0000022. Neither side has blinked yet, so what happens next actually matters here.
Live Market Data
$PEPE currently sits around $0.00000285, down 2.0% on the day. 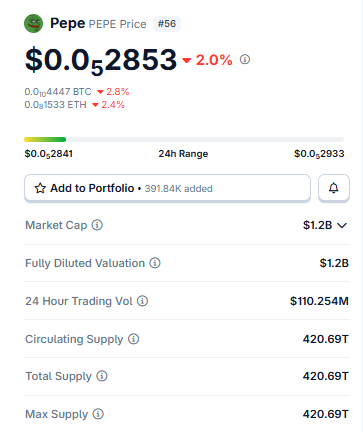
Source: $PEPE Market Cap Data Taken From Coingecko, data as of Aug 05, 2026. Figures may vary slightly across other tracking websites.
Market cap: $1.2 billion, and that number matches the fully diluted valuation.
since the entire max supply of 420.69 trillion tokens is already out there circulating. 24-hour volume comes in at $110.25 million.
Liquidation Data of $PEPE
Longs have really taken it on the chin here, based on the liquidation heatmap.
Total liquidations hit $186.38K over 24 hours, and $157.70K of that came from long positions, versus just $28.68K on the short side. 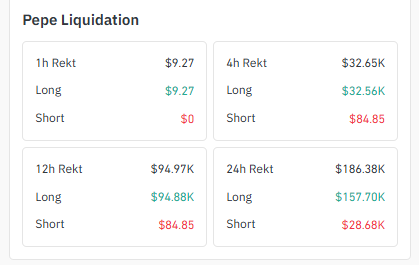
Source: Liquidation Data Taken From Coinglass.
Check the 1-hour window, and it's even more one-sided; every dollar wiped out came from a long.
That kind of imbalance usually points to buyers stepping in a bit early on bounces and paying for it.
Exchange Volume of $PEPE
Exchange volume for PEPE bunches up hard at the top. MEXC leads with $105.76 million over the past 24 hours, and OKX isn't far behind at $105.67 million. 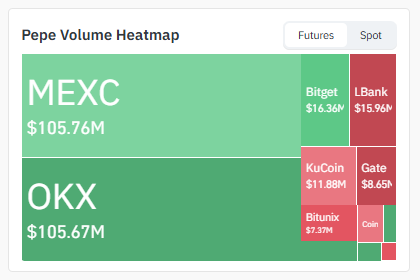
Source: Volume Heatmap Data Taken From Coinglass.
Bitget and LBank sit in the mid-teens of millions, with KuCoin, Gate, and Bitunix trailing further back.
Two exchanges carrying most of the flow means a big order on either one can move the price faster than the rest of the order book would suggest.
$PEPE New Today
Over 571,613 wallets now hold PEPE on Ethereum, putting it among the bigger memecoins by that measure. 
Source: Data Taken From @BSNNews , X Account.
Still, that number trails Shiba Inu's holder base by a wide margin, which sits above 1.6 million addresses, the largest of any memecoin. Even so, 571,000-plus is nothing to brush off.
It points to ownership spread across a real base of holders rather than a handful of wallets calling the shots.
Key Takeaways
-
PEPE trades near $0.00000286, pinned right at the apex of an ascending triangle on the daily chart.
-
Zoom into the 4H chart, and there's a tighter symmetrical triangle forming in that same zone.
-
Clear the upper boundary, and $0.00000343 opens up. Hold that, and $0.00000385 isn't far behind.
-
Lose the lower boundary instead, and $0.00000223 is first, with $0.00000181 waiting below it.
-
Longs have taken the bulk of recent liquidations. Buyers have been jumping the gun on bounces lately.
4H Chart: Symmetrical Triangle
Drop down to the 4H chart, and the picture tightens further.
A symmetrical triangle has formed, lower highs meeting higher lows in roughly the same zone as the daily pattern above. 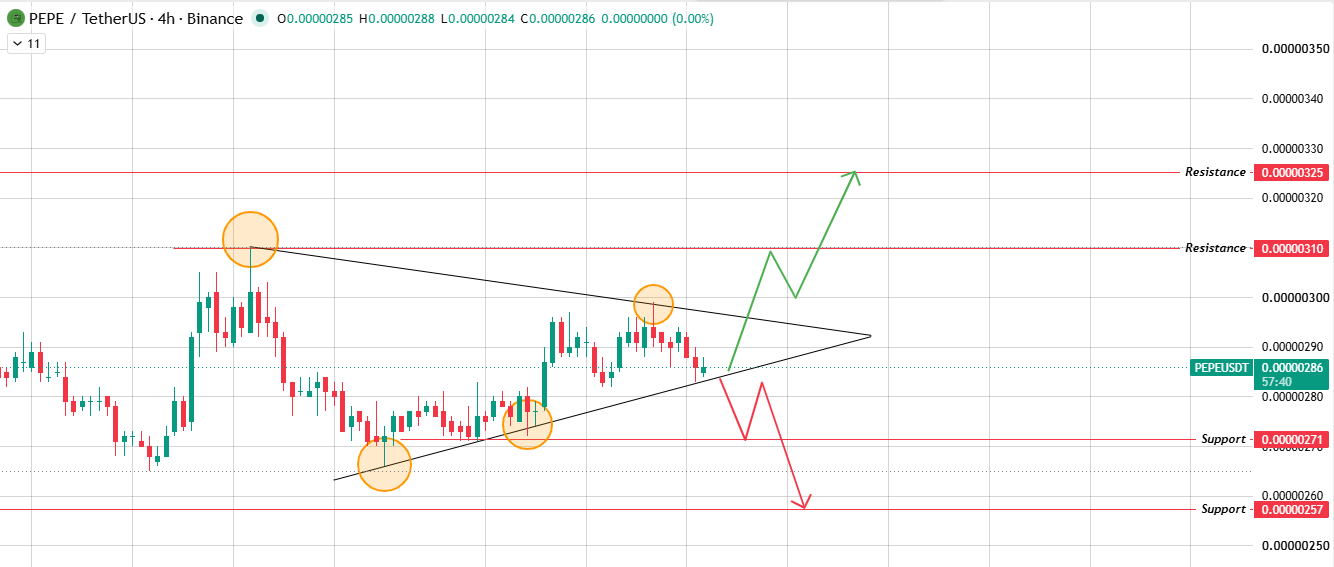
Source: Chart Taken From TradingView.
Break the top upper boundary of the structure, and $0.00000310 shows up first as a resistance level, with $0.00000325 next if momentum sticks around.
Break the bottom instead, and $0.00000271 is the first stop, then $0.00000257 if sellers don't let up.
Daily Chart: Ascending Triangle
Something's been building on the 1D chart. PEPE has carved out an ascending triangle, a rising support line climbing up to meet a flatter ceiling right around where price sits now. 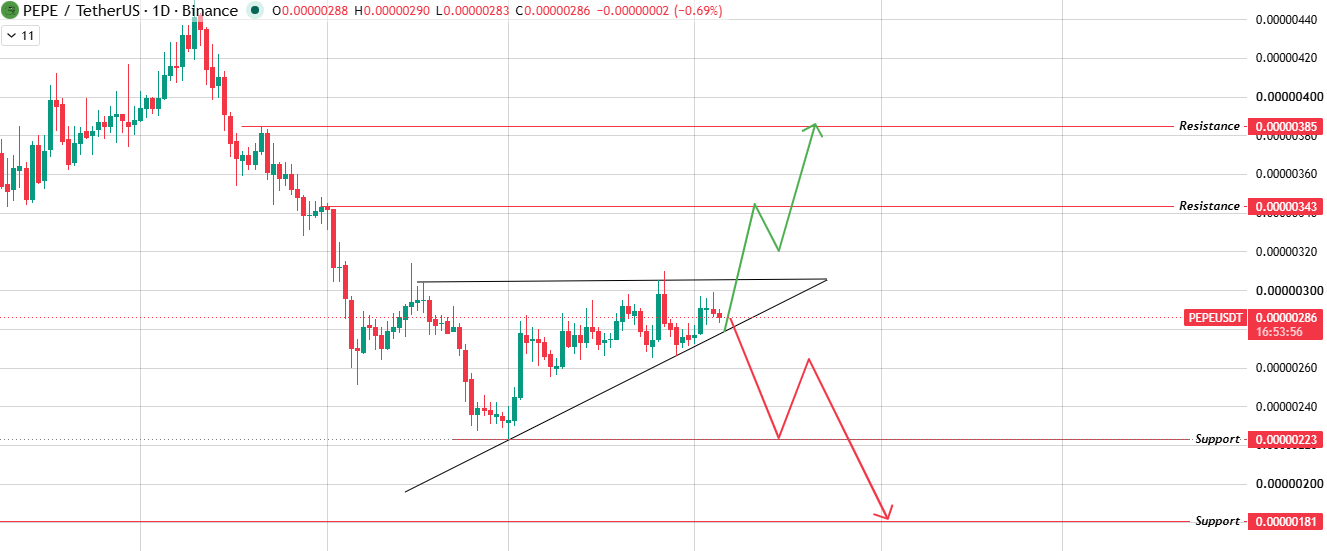
Source: Chart Taken From TradingView.
Clear that ceiling with a real bullish breakout, and $0.00000343 is the first stop, with $0.00000385 in reach if buyers keep showing up.
These patterns tend to lean bullish historically. That said, nothing's confirmed until it actually breaks.
Fail here, though, and a bearish breakdown through that rising support line sends price toward the support zone near $0.00000223. Keep falling, and $0.00000181 becomes the next stop down.
Bull, Base, and Bear Scenarios
So what flips it? The bull case falls apart if PEPE can't hold above $0.00000271 after trying to break out. The bear case falls apart if the price reclaims $0.00000310 on real volume.
Market Context
Memecoins move with the market's mood more than with anything happening on their own charts, and PEPE's no exception.
Climbing BTC dominance usually pulls capital out of smaller tokens like this one.
Add in PEPE's ETH correlation, and Ethereum's own price swings end up mattering here too. Both are worth a glance before leaning too hard into either of the breakout scenario above.
Glossary
Ascending Triangle: Flat resistance up top, a floor that keeps stepping higher underneath. The squeeze usually resolves upward, though not always.
Symmetrical Triangle: Two lines closing in on each other from opposite directions. Price runs out of room and has to pick a side.
Liquidation: Losses eat through the margin, and the exchange shuts the trade down. The trader doesn't get a say in the timing.
BTC Dominance: How much of the whole crypto market Bitcoin accounts for. Watch it climb, and smaller coins often start losing ground.
Methodology: This analysis is based on technical chart patterns read from TradingView, along with liquidation and exchange volume data sourced from Coinglass, all as of the time of writing. Price levels are derived directly from the charts referenced, with no extrapolation beyond what the structures show.
Disclaimer: This Pepe price prediction is for informational purposes only and does not constitute financial advice. Cryptocurrency markets, especially memecoins, are highly volatile and speculative. Always conduct independent research and consider your own risk tolerance before making any investment decisions.


















