Polkadot Price Prediction: Could $DOT 10x Now? $20 Target


$DOT is moving. Network activity is surging, daily transaction volume jumped 150%, and one well-known trader just called Polkadot one of his top 10x altcoin picks, floating a $20 target.
This Polkadot Price Prediction breaks down what the chart actually shows and how far the $DOT coin price is realistically from that kind of move.
Market data was checked on September 8, 2026, at 12:58 IST.
Polkadot Price Prediction Today: Market Overview
Metric | Value |
Price | $1.0655 |
24h Change | +10% |
Market Cap | $1.8B |
Unlocked Mkt Cap | $1.84B |
FDV | $2.22B |
24h Volume | $370.6M |
Vol/Mkt Cap (24h) | 20.56% |
Total Supply | 1.7B |
Max Supply | 2.1B |
Circulating Supply | 1.7B |
Source: Data from CoinMarketCap as of September 8, 2026, at 12:58 IST. Figures may vary slightly across other tracking websites.
$DOT Crypto News Today: Network Activity Jumps 19%
Polkadot's price jumped as network activity increased, according to a post from BSCN. DOT recorded a 19% price appreciation within 24 hours, moving alongside a 150% expansion in daily transaction volume.
The post described this as a significant recovery for the asset, with inter-chain messaging protocols reaching new quarterly highs in throughput.
Source: Data From BSCN
CoinGabbar could not independently verify the throughput figures beyond what was shared in the post.
Trader Calls DOT a Top 10x Pick, Floats $20 Target
Trader Celal Kucuker shared a bullish long-term view on DOT, saying a break of $1.30 on the weekly chart could see price reach $4 within weeks, with $10 mentioned as a further target if $4 resistance breaks, and $20 floated as a possibility in a strong bull run.
He listed $DOT among altcoins he sees long-term 10x potential in.
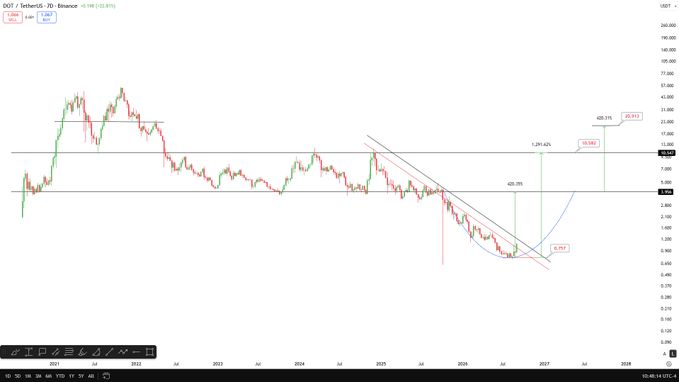
Source: Data From X
This is a personal opinion and price target from the trader, not verified data, and CoinGabbar could not independently verify these projections.
None of the $4, $10, or $20 figures appear as marked levels on the chart used for this analysis below.
DOT Chart Analysis: Trendline Break and EMA Levels
Pair: DOT/USDT · Market: Spot (Crypto) · Exchange: OKX · Timeframe: 1D · Source: TradingView · Timestamp: September 8, 2026, 04:28 UTC-3
DOT is trading at $1.0655, after breaking above a long descending trendline that had capped the price since May.
The breakout was sharp, pushing price well above both EMAs in a single session.
The EMA readings sit at $0.9073 for the 20-period and $0.8757 for the 50-period, both now well below the current price and acting as support if the move gets retested.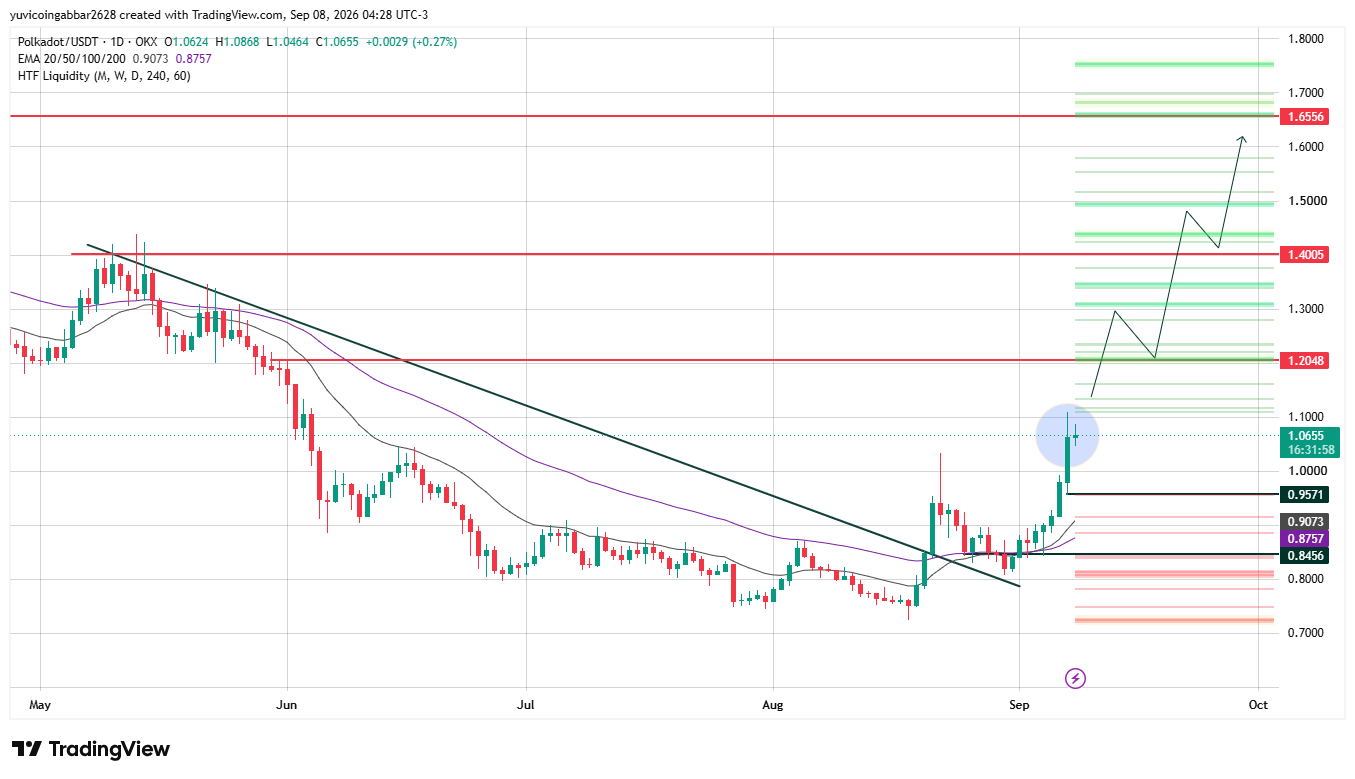
Polkadot Price Forecast and Outlook: Key Levels to Watch
Level Type | Price |
Resistance 3 | $1.6556 |
Resistance 2 | $1.4005 |
Resistance 1 (nearest) | $1.2048 |
Immediate Price Reference | $1.0655 |
First Confirmed Support | $0.9571 |
Deeper Support | $0.8456 |
Polkadot Liquidation and Volume Data
This is Coinglass futures data and stays separate from the CoinGecko spot volume figures above.
Window | Total Rekt | Long | Short |
12h | $371.33K | $305.86K | $65.47K |
24h | $1.12M | $532.66K | $584.14K |
Long liquidations dominate the 12h window, showing some leveraged longs got shaken out even as the price trended higher.
Futures volume is led by Binance at $206.13M, followed by OKX at $71.64M, LBank at $54.11M, Bybit at $47.70M, and MEXC at $34.91M, with smaller volume spread across Gate, Bitget, Bitunix, BingX, and KuCoin.
DOT Price Prediction: Bull Case vs Bear Case
Bull case: Holding above the first confirmed support at $0.9571 keeps the trendline breakout intact, opening a path toward $1.2048 and then $1.4005 if network activity and volume stay elevated.
Bear case: A close back below $0.9571 would put the breakout in doubt, and a deeper break under the EMA cluster near $0.8757 to $0.9073 would expose $0.8456 as the next downside target.
DOT Price Scenarios: Triggers and Invalidation
Scenario | Trigger | Likely Outcome | Invalidation Point |
Trendline reclaim (bullish) | Hold above $0.9571 | Move toward $1.2048, then $1.4005 | Close below $0.9571 |
Channel hold | Range between $0.9571 and $1.2048 | Consolidation before next leg | Break of either bound |
Channel breakdown (bearish) | Close below EMA cluster ($0.8757–$0.9073) | Slide toward $0.8456 | Reclaim of $0.9571 |
Can DOT Reach $1.6556?
$1.6556 is the highest resistance level marked on the chart.
Reaching it would take a multi-stage move: clearing $1.2048, then holding above $1.4005, before a run at $1.6556 becomes realistic.
Could $DOT 10x to $20?
A 10x from $1.0655 would put DOT near $10.65, and the $20 figure floated by Celal Kucuker would be closer to a 19x.
Neither level appears anywhere on the current chart, where the highest marked resistance is $1.6556.
That kind of move isn't supported by the technicals shown here; it would require a multi-year, market-wide bull cycle far beyond what today's breakout indicates, with no guarantee it happens.
Polkadot Price Prediction: Expert View
According to CoinGabbar analysts, The trendline break and jump in network activity give DOT a genuine short-term setup, and long-heavy liquidations show the move is shaking out leverage rather than fading.
The $4-to-$20 talk is a personal long-term view, not something the chart currently supports. $0.9571 is the level that decides whether this breakout holds.
Disclaimer
This piece is for informational purposes only and isn't financial advice. The levels and scenarios above are based on technical chart analysis and publicly available data at the time of writing, and crypto markets can move sharply within hours, so past patterns don't guarantee future outcomes.
Also read:

















