Pudgy Penguins Price Prediction 2040: Could PENGU Really Hit $5?


A niche NFT drop turning into one of crypto's most recognizable brand-meme hybrids is a strange kind of success story.
But being famous and being valuable aren't the same thing.
That's the real question here: Does PENGU's cultural pull ever translate into a serious long-term price move, or does it stay a fun brand riding a token that never breaks out?
This Pudgy Penguins price prediction 2040 works straight off the Fibonacci structure drawn on the monthly chart, using the levels printed on it to map a realistic path over the next decade and a half.
Every number here traces back to the chart itself no guesswork, no rounding up to make the story sound nicer.
Quick Snapshot: Where PENGU Sits Today
Current price: $0.006145
This month's range: opened at $0.006007, ran up to $0.006936, dipped to $0.005866, and settled near current levels, up 2.33% on the month
All-time high: around $0.04627, set in January 2025
Circulating supply: roughly 62.86 billion PENGU out of an 88.89 billion max supply
Market cap: sitting between $390 and $415 million
PENGU is still well below its all-time high, working through the same long correction that's followed that peak.
The Chart's Fibonacci Map
The monthly chart has a Fibonacci grid stretched from the post-crash low through PENGU's biggest historical rally, extended well past the old high to map longer-range targets. 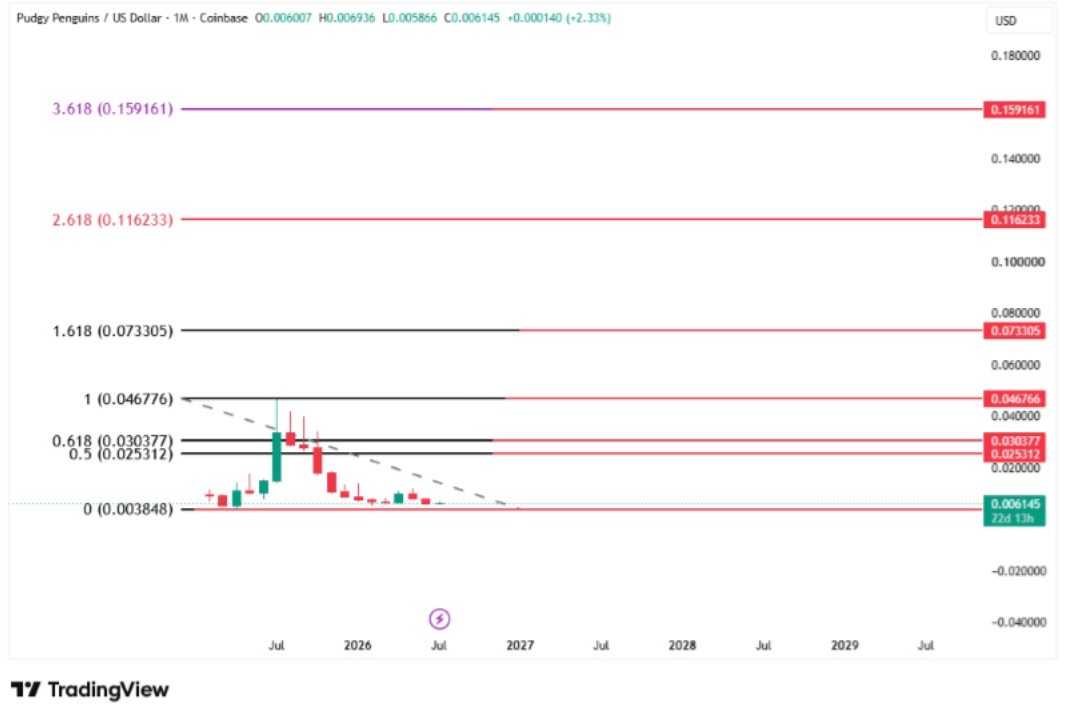
Source: Chart Taken From TradingView
| Fib Level | Price |
|---|---|
| 0 (Base) | $0.003848 |
| 0.5 | $0.025312 |
| 0.618 | $0.030377 |
| 1.0 (Old High Zone) | $0.046776 |
| 1.618 (Extension) | $0.073305 |
| 2.618 (Extension) | $0.116233 |
| 3.618 (Extension) | $0.159161 |
$PENGU Price is sitting at $0.006145, just above the $0.003848 base and well below the 0.5 fib level.
A descending trendline connects the early high down toward this base, and price is basically parked right where that trendline meets the zero line exactly the kind of spot a long-term bottom tends to form.
Two Very Different Futures
$PENGU keeps drifting near this base, testing it occasionally, without a real move higher.
It breaks free, works through 0.5 and 0.618, retests them as support once flipped, and climbs toward 1.0 and eventually the 1.618, 2.618, and 3.618 extensions.
The fork comes down to whether this basing zone becomes a launchpad rather than just a floor.
A confirmed break above $0.025312 would be the first real sign of that.
$PENGU Price Prediction in 2026
PENGU is probably still stuck near $0.003848 for most of this year, with the descending trendline capping any real rally.
Watch whether it clears that trendline and pushes toward $0.025312.
A failed attempt still shows demand building; a clean break signals the basing phase is ending.
$PENGU Price Prediction in 2028
If the bullish path holds, PENGU works through $0.025312 and $0.030377, pushing toward $0.046776 near the old all-time high.
Supply still matters; a meaningful chunk sits on vesting tied to team and company allocations, and that steady drip needs real demand behind it, or these levels just get touched and rejected.
$PENGU Price Prediction in 2035
The 1.618 extension at $0.073305 becomes realistic here, a genuine break past the old high, not just a retest.
By now most scheduled vesting should be done, removing a real headwind. What matters more is whether the brand still lands with a mainstream audience a decade out.
$PENGU Price Prediction in 2040
This is the whole point of the piece.
Past 1.618, the chart's next stops are 2.618 at $0.116233 and 3.618 at $0.159161 aggressive targets assuming PENGU compounds through multiple cycles over a decade-plus.
Getting there means the brand kept pulling fresh capital well past its original hype cycle.
Just as possible: PENGU never breaks out meaningfully, and a 2040 price still in the low single-digit-cents range stays on the table.
The $5 Scenario: What Multiple Bull Cycles Could Add Up To
Fourteen years is long enough for three or four full bull-and-bear cycles, not one clean move; that's the real argument behind a number like $5.
Worth being straight about the math though: at PENGU's 88.89 billion max supply, $5 means a roughly $444 billion market cap, far beyond even the chart's most aggressive 3.618 extension.
Not impossible over a multi-cycle horizon, but it needs a lot to go right in sequence. Treat it as the ceiling if everything lines up, not the expected outcome.
Target Table (2026–2040)
| Year | Low | Mid | High | Multi-Cycle Bull Case |
|---|---|---|---|---|
| 2026 | $0.003848 | $0.006145 | $0.025312 | — |
| 2028 | $0.015000 | $0.030377 | $0.046776 | — |
| 2032 | $0.030000 | $0.046776 | $0.073305 | $0.50 |
| 2035 | $0.050000 | $0.073305 | $0.116233 | $2.00 |
| 2040 | $0.080000 | $0.116233 | $0.159161 | $5.00 |
What Actually Decides This
Does the NFT-to-brand bridge hold up? PENGU's edge has always been the toys, licensing deals, and community around the actual penguin IP.
Lose that, and the demand story loses its foundation.
Can PENGU break its current range? This is the biggest gate on the chart. Every target above $0.025312 assumes this base turns into a launchpad, not a holding pattern.
The supply overhang. A meaningful share of max supply is still vesting over the next couple of years; if unlocks outpace demand, they'll cap rallies early.
Broader meme coin and altcoin cycles. PENGU follows the same risk-on, risk-off rhythm as the rest of the sector, so the wider crypto market shapes how fast, or whether, these levels get tested.
Bottom Line
PENGU's chart lays out a genuinely widespread array of outcomes, and that's the honest takeaway, not a hedge.
Fifteen years is enough time for several full market cycles to rewrite this story completely.
Treat $0.159161 as the aspirational ceiling and the $5 scenario as exactly that a scenario, not a promise.
Keep an eye on $0.025312 in the meantime, since breaking it is what starts the clock on everything else here.
Disclaimer: This article is for informational purposes only and does not constitute financial, investment, or trading advice. Cryptocurrency markets are highly volatile and speculative. All price levels and scenarios discussed, including long-term forecasts out to 2040, are based on chart analysis and publicly available data, and are not guarantees of future performance. Always do your own research and consult a licensed financial advisor before making any investment decisions.
Also read:












.webp)




