Pudgy Penguins Price Prediction: PENGU Launchpad Buzz Meets Chart Test


Pudgy Penguins price prediction is playing out as a classic tug-of-war right now, with bulls trying to hold the line after getting turned away at resistance.
Pudgy Penguins built its identity around the Pudgy Penguins NFT collection before launching PENGU as its native token, and it has kept a genuinely active community through some rough stretches for NFT-linked coins.
$PENGU is currently trading at $0.008676, down 0.3% on the day, after a sharp bounce off a long rounded-bottom structure ran straight into a falling trendline and got rejected.
Pudgy Penguins Live Market Data
Metric | Value |
Price | $0.008676 |
24h Change | -0.3% |
24h Range | $0.008504 - $0.008883 |
Market Cap | $546.228M |
Fully Diluted Valuation | $666.686M |
24h Trading Volume | $210.023M |
Circulating Supply | 62.86B |
Total Supply | 76.723B |
Max Supply | 88.889B |
Source: PENGU market data as of Sep 07, 2026. Figures may vary slightly across other tracking websites.
Exchange Volume
Binance is carrying the largest share of PENGU volume at $62.43M, well ahead of OKX at $20.41M and Bybit at $16.45M.
WhiteBIT ($8.42M), Bitget ($5.83M), KuCoin ($6.89M), and MEXC ($6.49M) make up the next tier, with Bitunix, BingX, Gate, and LBank contributing smaller amounts.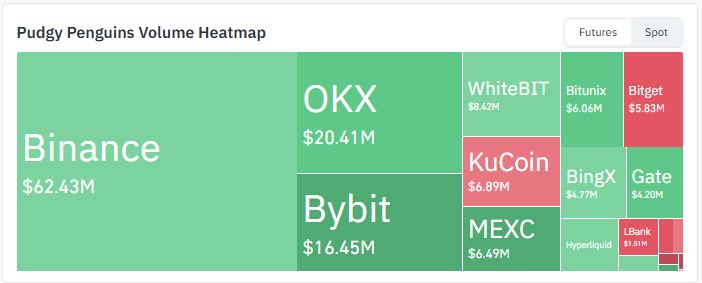
Source: Volume heatmap data taken from CoinGlass, as of Sep 07, 2026.
Liquidation Data
Timeframe | Total Liquidated | Longs | Shorts |
1h | $10.83K | $9.41K | $1.41K |
4h | $16.52K | $14.70K | $1.82K |
12h | $59.27K | $56.49K | $2.78K |
24h | $140.72K | $135.32K | $5.39K |
Source: Liquidation data taken from Coinglass, as of Sep 07, 2026.
Longs have taken by far the bigger hit across every timeframe here, with $135.32K wiped out over 24 hours against just $5.39K on shorts.
That kind of one-sided liquidation usually shows up right after a rejection like this one, when traders who bought into the bounce get caught as the price turns back down toward support.
Pudgy Penguins Coin News
PENGU picked up a notable integration today.
A launchpad platform confirmed that new coins can now be launched paired directly with $PENGU, with the feature built in partnership with the Pudgy Penguins team itself.
Source: Data Taken From @LaunchOnSF, X Account.
It's the kind of ecosystem news that doesn't move price on its own, but it does add a bit of underlying utility to a token that has mostly traded on sentiment and NFT-market strength up to this point.
Pudgy Penguins Price Prediction Outlook: Technical Analysis
The daily PENGU/USDT chart on Binance shows a long rounded-bottom structure that formed over several months, with a tighter consolidation box sitting just above it.
Price broke out of that box with a sharp upward bounce, only to run straight into a falling trendline that has capped PENGU's rallies for most of the year. That rejection is what's pulling the price back down to test support now.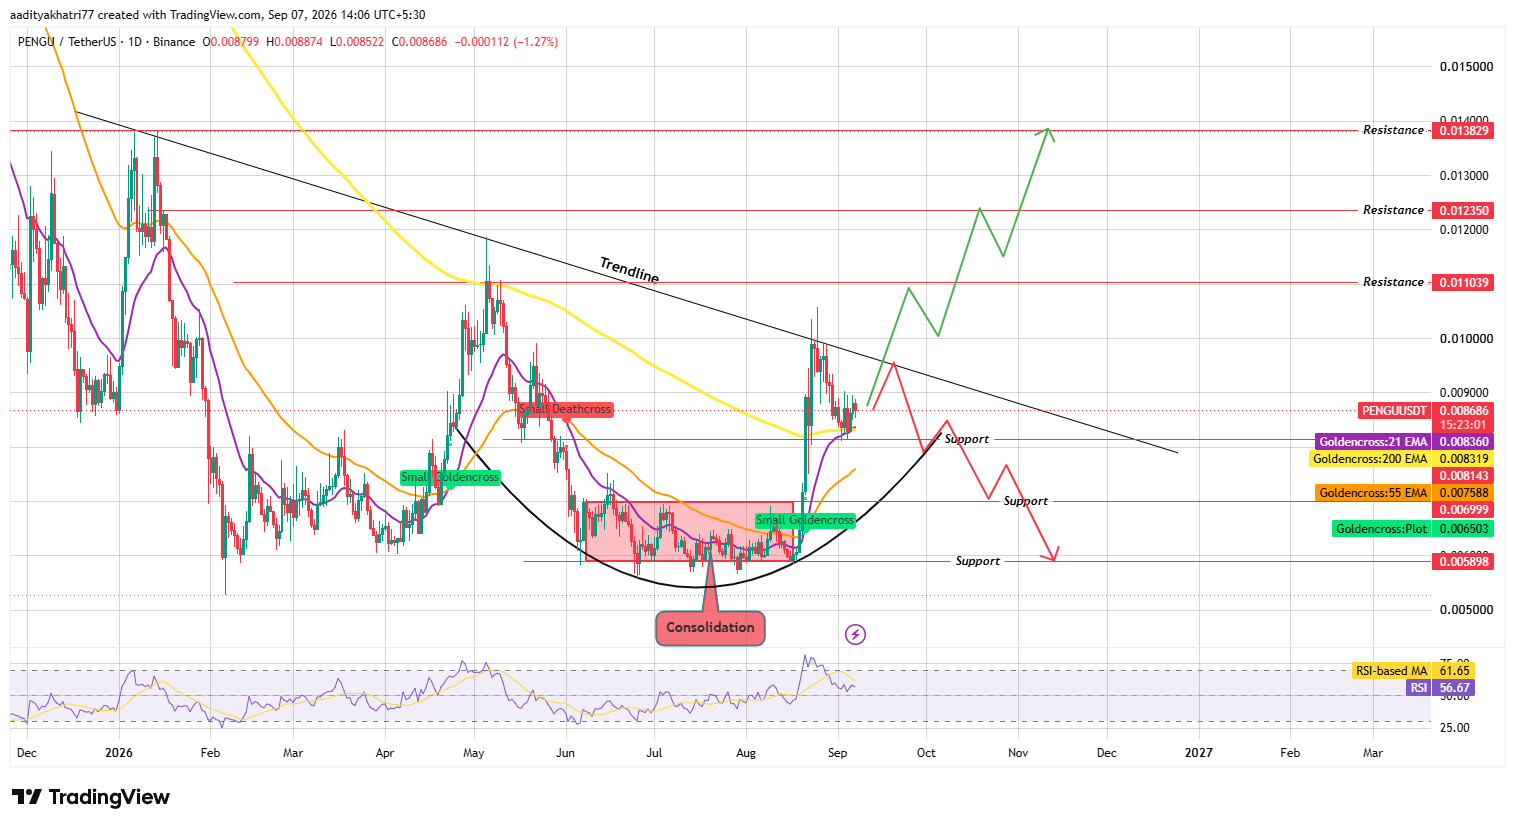
Source: Chart taken from TradingView, Binance PENGU/USDT pair, as of Sep 07, 2026, 14:06 UTC+5:30, daily timeframe.
Can PENGU Break the Falling Trendline?
If support holds here and buyers step back in with volume, a retest and eventual break of that falling trendline would open the door to $0.011039.
Clear that on a confirmed close, and $0.012350 comes into view, with $0.013829 as the extended target if the move keeps building.
What Happens If PENGU Loses Support?
If the trendline rejection turns into a deeper pullback instead, a confirmed break below the $0.008319 support zone would put the recent breakout structure at risk.
Lose that, and $0.007588 becomes the next level to watch, with a much deeper support at $0.005898 if the sell-off extends further.
RSI is at 56.67, still below its moving average of 61.65, having recently cooled off from stronger readings during the bounce.
That combination suggests momentum has eased since the rejection without turning outright bearish yet.
Support and Resistance Levels (Daily Chart)
Level Type | Price |
Resistance 3 | $0.013829 |
Resistance 2 | $0.012350 |
Resistance 1 | $0.011039 |
Support 1 | $0.008319 |
Support 2 | $0.007588 |
EMA Levels (Daily Chart)
EMA | Price |
21 EMA | $0.008360 |
55 EMA | $0.007588 |
200 EMA | $0.008319 |
Pudgy Penguins Price Prediction: Bull, Base, and Bear Scenarios
Scenario | Setup | Level |
Bull Case | Support holds, falling trendline breaks on a confirmed close with volume | $0.011039, then $0.012350 |
Base Case | Price chops between support and the trendline without a clear break | Range-bound between $0.008319 and $0.008883 |
Bear Case | Support fails, confirmed close below the recent breakout base | $0.007588, with deeper risk toward $0.005898 |
Glossary
A rounded bottom is a slow, curved recovery pattern that forms when selling pressure fades out gradually rather than reversing sharply, and it's usually read as an early sign that a longer downtrend is losing its grip.
A falling trendline connects a series of lower highs, and it acts as a moving ceiling on price until a strong enough move finally breaks through it.
PENGU has already tested this same trendline and gotten turned away, which is part of why the current retest matters.
RSI, the familiar 0-to-100 momentum gauge, is doing its usual job here of showing whether the recent cooldown is just a pause or the start of something more bearish.
Liquidation is what happens when a leveraged position gets force-closed because there isn't enough margin left to cover the loss, and the long-heavy numbers on this chart show plenty of traders got caught buying right into the rejection.
Pudgy Penguins vs Bitcoin
PENGU's trendline rejection looks tied to its own chart pattern and today's launchpad news more than anything specific happening with Bitcoin.
That said, PENGU still tends to lean on Bitcoin's broader mood during breakout attempts like this one.
A steady or rising Bitcoin would make a trendline break more achievable, while a weak Bitcoin session would likely add extra pressure on top of the rejection already in play.
Expert Opinion
Traders following PENGU's chart point out that a rounded bottom breaking into a fresh consolidation box, followed by a sharp bounce and an immediate rejection at long-term resistance, is a fairly textbook sequence.
The launchpad integration adds a longer-term utility angle worth watching, but in the near term, this remains a support-versus-trendline story that the next few daily candles should help settle.
Disclaimer: This Pudgy Penguins price prediction is based on technical chart analysis and current market data and should not be treated as financial advice. Cryptocurrency markets are highly volatile, and actual price movements may deviate significantly from projected scenarios. Support and resistance levels discussed represent probability zones, not guaranteed outcomes, and downside risk exists at every stage of this analysis. Readers should conduct independent research before making investment decisions.
Also read:

















