Pyth Network Price Prediction: $PYTH Breakout or Trap? What’s Next?


$PYTH is one of the coins traders keep coming back to, and more people are talking about it every day.
This Pyth Network price prediction comes at a time when interest in the coin is growing fast, with traders trying to get in early before the next big move.
Pyth Network is a project that shares real-time market data on the blockchain, according to its own website.
Moves like this don't wait around for long, so stick with us till the end."
Market data was checked on September 1, 2026, at 16:08 IST.
Pyth Network Price Prediction Today: Market Overview
Metric | Value |
Price | $0.049057 |
24h Change | +2% |
Market Cap | $384.96M |
FDV | $488.86M |
24h Volume | $17.14M |
Vol/Mkt Cap (24h) | 4.37% |
Liquidity/Mkt Cap | 0.13% |
Total Supply | 9.99B PYTH |
Max Supply | 10B PYTH |
Circulating Supply | 7.87B PYTH |
Holders | 304.5K |
Source: Data from CoinMarketCap as of September 1, 2026, at 16:08 IST. Figures may vary slightly across other tracking websites.
$PYTH Liquidation and Volume Data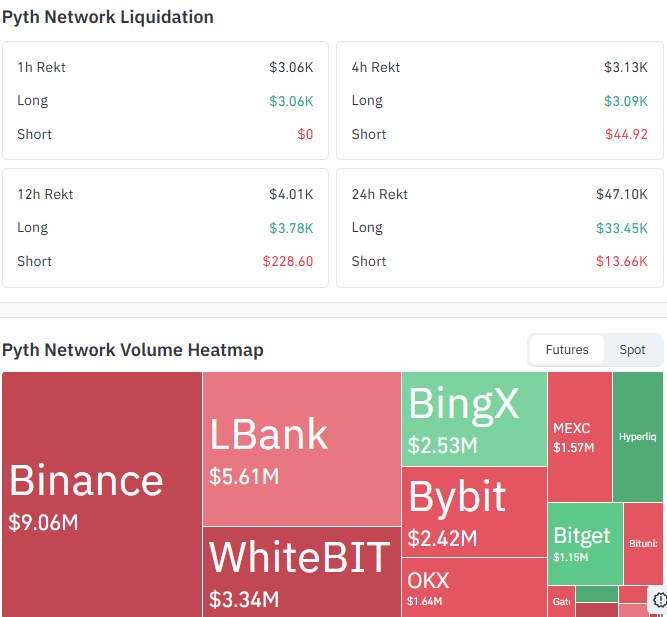
Source: Data From CoinGlass
Over the past 12 hours, total liquidations came in at $4.01K, with longs accounting for $3.78K and shorts making up just $228.60.
Stretched out to the 24-hour window, total liquidations jumped to $47.10K, with longs taking the bigger hit at $33.45K and shorts at $13.66K.
The heavier long liquidations across both timeframes point to traders betting on upside getting caught off guard, a sign the recent move has leaned bearish in the short term.
On the futures volume side, Binance leads with $9.06M in $PYTH trading volume, followed by LBank at $5.61M and WhiteBIT at $3.34M.
Other exchanges like BingX, Bybit, OKX, MEXC, and Bitget also show solid activity, showing $PYTH is being traded actively across the board."
Pyth Network Price Prediction Chart: Technical Analysis
Pair: PYTH/USDT · Market: Spot (Crypto index) · Timeframe: 1D · Source: TradingView · Timestamp: September 1, 2026, 14:08 UTC+5:30
PYTH is trading at $0.049057, sitting right at the top of a symmetrical triangle that has been tightening since early this year.
Price is currently in a consolidation stage, and a breakout in either direction will define the next move keep an eye on the key levels below.
The EMA cluster sits just below the spot, with the 20 EMA at $0.046637 and the 50 EMA at $0.044357, both acting as nearby support.
RSI (14) reads 60.02 against its 63.97 average, neutral, and sitting just below its own moving average.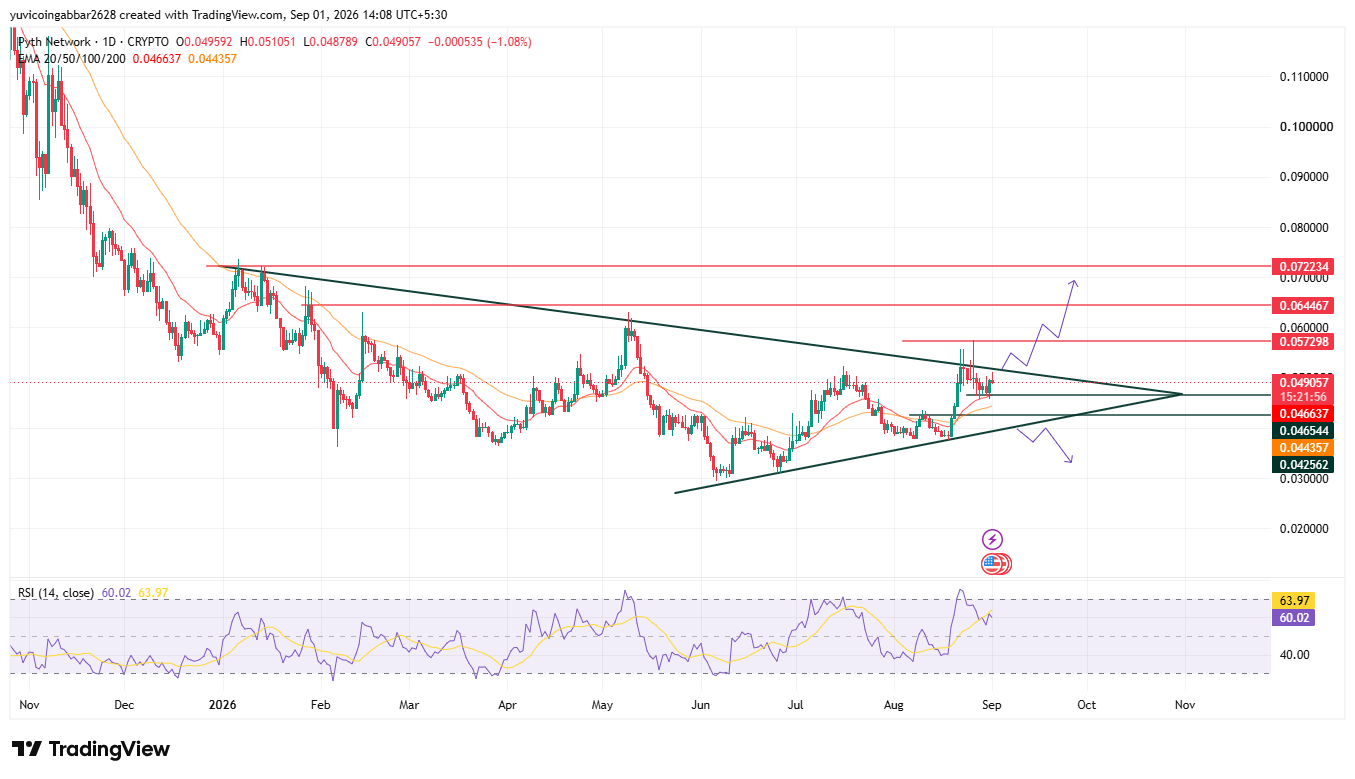
Pyth Network Price Prediction: Key Levels
Level Type | Price |
Resistance 3 | $0.072234 |
Resistance 2 | $0.064467 |
Resistance 1 (nearest) | $0.057298 |
Immediate Price Reference | $0.049057 |
First Confirmed Support | $0.042562 |
$PYTH Forecast: Bull Case vs Bear Case
Bull case: A daily close above $0.057298 would confirm $PYTH is breaking out of the triangle to the upside, opening a path toward $0.064467 and eventually $0.072234.
Bear case: A close back below $0.049057 and then $0.042562 would suggest the triangle is resolving downward instead, putting the recent stabilization in question.
$PYTH Price Scenarios: Triggers and Invalidation
Scenario | Trigger | Likely Outcome | Invalidation Point |
Triangle breakout (bullish) | Daily close above $0.057298 | Move toward $0.064467, then $0.072234 | Close back below $0.049057 |
Range-bound (hold) | Price holds between $0.042562 and $0.057298 | Continued triangle chop, no clear trend | Break of either boundary |
Triangle breakdown (bearish) | Daily close below $0.042562 | Drop back toward the 2026 range lows | Reclaim above $0.042562 |
Can $PYTH Reach $0.072234?
$0.072234 is the highest resistance marked on the chart.
Getting there would need $PYTH to first clear $0.057298, then hold above $0.064467, a multi-stage breakout rather than a single leg.
Pyth Network Price Prediction: Expert View
According to CoinGabbar analysts, $PYTH sitting right at the triangle top means a decisive move is likely close, in either direction.
$0.049057 to $0.057298 is the zone that decides which way it breaks.
Disclaimer
This piece is for informational purposes only and isn't financial advice. The levels and scenarios above are based on technical chart analysis and publicly available data at the time of writing, and crypto markets can move sharply within hours. Do your own research and consider your own risk tolerance before acting on anything discussed here.
Also read:
















