Raydium Price Prediction September 2026: $RAY Signals Bigger Upside


$RAY is heating up, ripping off its multi-month base while traders buzz about a possible repeat of its old blowout rally.
This Raydium Price Prediction September 2026 breaks down the September outlook: the bullish case stays alive above $0.74216, and a close above $0.87622 could open the door higher.
Market data was checked on August 27, 2026, at 11:03 IST.
Raydium Price Prediction September 2026: Market Overview
Metric | Value |
Price | $0.79659 |
24h Change | +1% |
Market Cap | $215.59M |
Unlocked Market Cap | $443.92M |
FDV | $443.92M |
24h Volume | $14.1M |
Vol/Mkt Cap (24h) | 6.5% |
Liquidity/Mkt Cap | 4.78% |
TVL | $1.1B |
Market Cap/TVL | 0.1951 |
Total Supply | 554.99M RAY |
Max Supply | 555M RAY |
Circulating Supply | 269.53M RAY |
Holders | 198.47K |
Source: Data from CoinMarketCap as of August 27, 2026, at 11:03 IST. Figures may vary slightly across other tracking websites.
What Traders Are Saying: The $1.27 Reclaim Setup (Raydium)
A widely shared post from trader account Crypto Patel argues RAY is back inside the $0.70 to $0.50 zone that preceded its earlier sharp rally, calling it a multi-month re-accumulation base.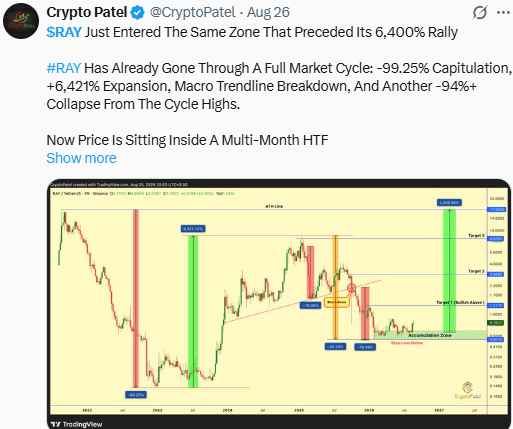
Source: Data From X
The post flags a weekly close above $1.27 as the trigger for a bullish structural shift, with a weekly close below $0.50 as the invalidation point.
CoinGabbar could not independently verify the figures cited, and this reflects one trader's view, not confirmed data.
Technical Analysis: Key Support and Resistance $September 2026
Pair: RAY/USDT · Market: Spot (Crypto) · Exchange: Aggregated · Timeframe: 1D · Source: TradingView · Timestamp: August 27, 2026, 11:03 UTC+5:30
RAY closed at $0.79659, after breaking above the long-term descending trendline that had capped the price since the February high.
The breakout came off a multi-month base near $0.70 to $0.74, with a sharp rally taking the price up to test the $0.87622 zone before pulling back to current levels.
The EMA cluster sits well below price, with the EMA 20 at $0.70582 and the EMA 50 at $0.67317, both acting as support beneath the recent move rather than resistance overhead.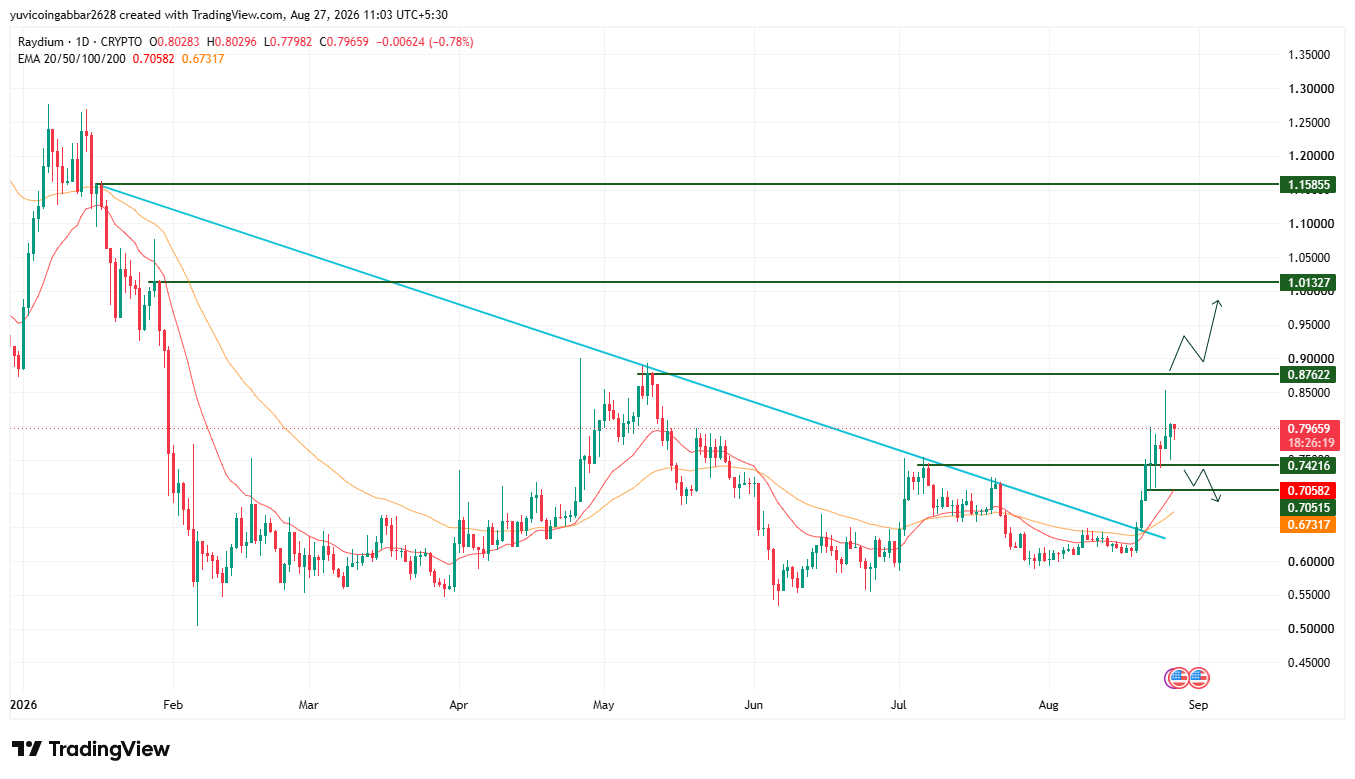
Raydium Price Prediction September 2026: key Levels
Level Type | Price |
Resistance 3 | $1.15855 |
Resistance 2 | $1.01327 |
Resistance 1 (nearest) | $0.87622 |
Immediate Price Reference | $0.79659 |
First Confirmed Support | $0.74216 |
Structural Floor | $0.70515 |
$September 2026 Prediction: Bull, Base and Bear Cases (Raydium)
Bull case: A daily close above $0.87622 would confirm the trendline breakout is extending, opening a path toward $1.01327 and eventually $1.15855 if buying pressure keeps building.
Base case: RAY consolidating between $0.74216 and $0.87622, digesting the recent rally before attempting a fresh push higher.
Bear case: Losing $0.74216 would put the breakout in doubt and suggest the rally was a temporary squeeze, exposing the EMA cluster and structural floor near $0.70515 to $0.70582.
Raydium Price Scenarios September 2026: What to Know
Scenario | Trigger | Likely Outcome | Invalidation Point |
Trendline breakout hold (bullish) | Daily close above $0.87622 | Move toward $1.01327, then $1.15855 | Close back below $0.77982 |
Retest and hold | Pullback holds above $0.74216 | Stabilization before retrying $0.87622 | Break below $0.74216 |
Range-bound | Price oscillates between $0.74216 and $0.87622 | Sideways chop, no clear trend | Break of either boundary |
Trendline breakdown (bearish) | Daily close below $0.74216 | Drop toward the $0.70515 EMA cluster | Reclaim above $0.74216 |
$September Catalysts That Could Move the Price (Raydium)
Renewed trader attention around a long-term reclaim setup has coincided with the recent breakout, though the 24h volume pulling back against a still-elevated market cap suggests some of the initial burst has cooled.
Raydium's role as a Solana-based decentralized exchange with sizable TVL relative to market cap can also draw sentiment tied to broader Solana DeFi activity.
Can RAY Reach $1.15855 in September 2026?
$1.15855 is the highest resistance level marked on the chart.
Reaching it would require RAY to first clear $0.87622, then hold above $1.01327, a multi-stage move that would likely need sustained volume at each stage rather than one sharp spike.
Raydium Price Prediction September 2026: Expert View
According to CoinGabbar analysts, the trendline breakout and bullish EMA alignment are the strongest signals here, backed by a solid multi-month base below the current price.
The $0.74216 to $0.87622 zone is the real battleground for September: holding above it keeps the recovery alive, while a slip back below the EMA cluster would suggest the breakout was a false start.
Disclaimer: This piece is for informational purposes only and is not financial advice. The levels and scenarios above are based on technical chart analysis and publicly available data at the time of writing, and crypto markets can move sharply within hours, so past patterns do not guarantee future outcomes. It is worth doing independent research and considering your own risk tolerance before acting on any of the levels discussed here.
Also read:

















