PolySwarm Price Prediction: Can NCT Beat Ethereum After Upbit?

A tiny cybersecurity token just did something most large caps cannot manage in a month; it moved over 200% in a single day. That kind of jump grabs attention fast. But does it mean anything once the noise settles? Keep that question in mind as we walk through the numbers.
Why Is Everyone Talking About PolySwarm Today?
PolySwarm price prediction conversations rarely start this loud. NCT, the token behind the PolySwarm threat-detection network, didn't drift higher on its own.
It got a direct push. A fresh Upbit KRW trading pair opened South Korea's market to Nectar, and traders responded within hours, according to a recent project update shared by the team.
The listing itself is confirmed across social channels tied to the project, with PolySwarm's own account crediting crypto.news for first flagging the coverage.
Exchange listings on a market as liquid as Korea's often produce exactly this kind of spike. New buyers, new liquidity, and a rush of momentum traders chasing the crypto exchange listing headline.
And that's not the only thing happening around the project this quarter. PolySwarm has also been building enterprise ties, a detail worth tracking alongside any upcoming coin events tied to the token.
None of that changes the chart overnight. But it does explain why volume, not vibes, is doing the heavy lifting here.
PolySwarm Price Today: Live Market Snapshot
As of 18:16 UTC on August 26, 2026, NCT trades near $0.01636, up 208.49% in 24 hours, according to CoinMarketCap.
Market cap sits at $30.86M, per CoinMarketCap data. Fully diluted value is almost identical at $30.87M, since nearly all 1.88B NCT tokens are already circulating.
Trading volume over the same period hit $152.53M, according to CoinMarketCap. That is a volume-to-market-cap ratio above 490%.
Put simply, more dollars changed hands in a day than the entire market cap is worth, five times over. That's an extreme reading, and it usually cools off fast, a pattern worth comparing against other latest price forecasts across the market.
Holder count stands at 8.98K per CoinMarketCap, a small base for a token now pulling this much attention.
PolySwarm Daily Chart Analysis
The daily structure shows a falling wedge breakout, based on the TradingView chart. NCT had spent close to a year grinding lower inside a narrowing pattern before this candle broke above the upper trendline with force.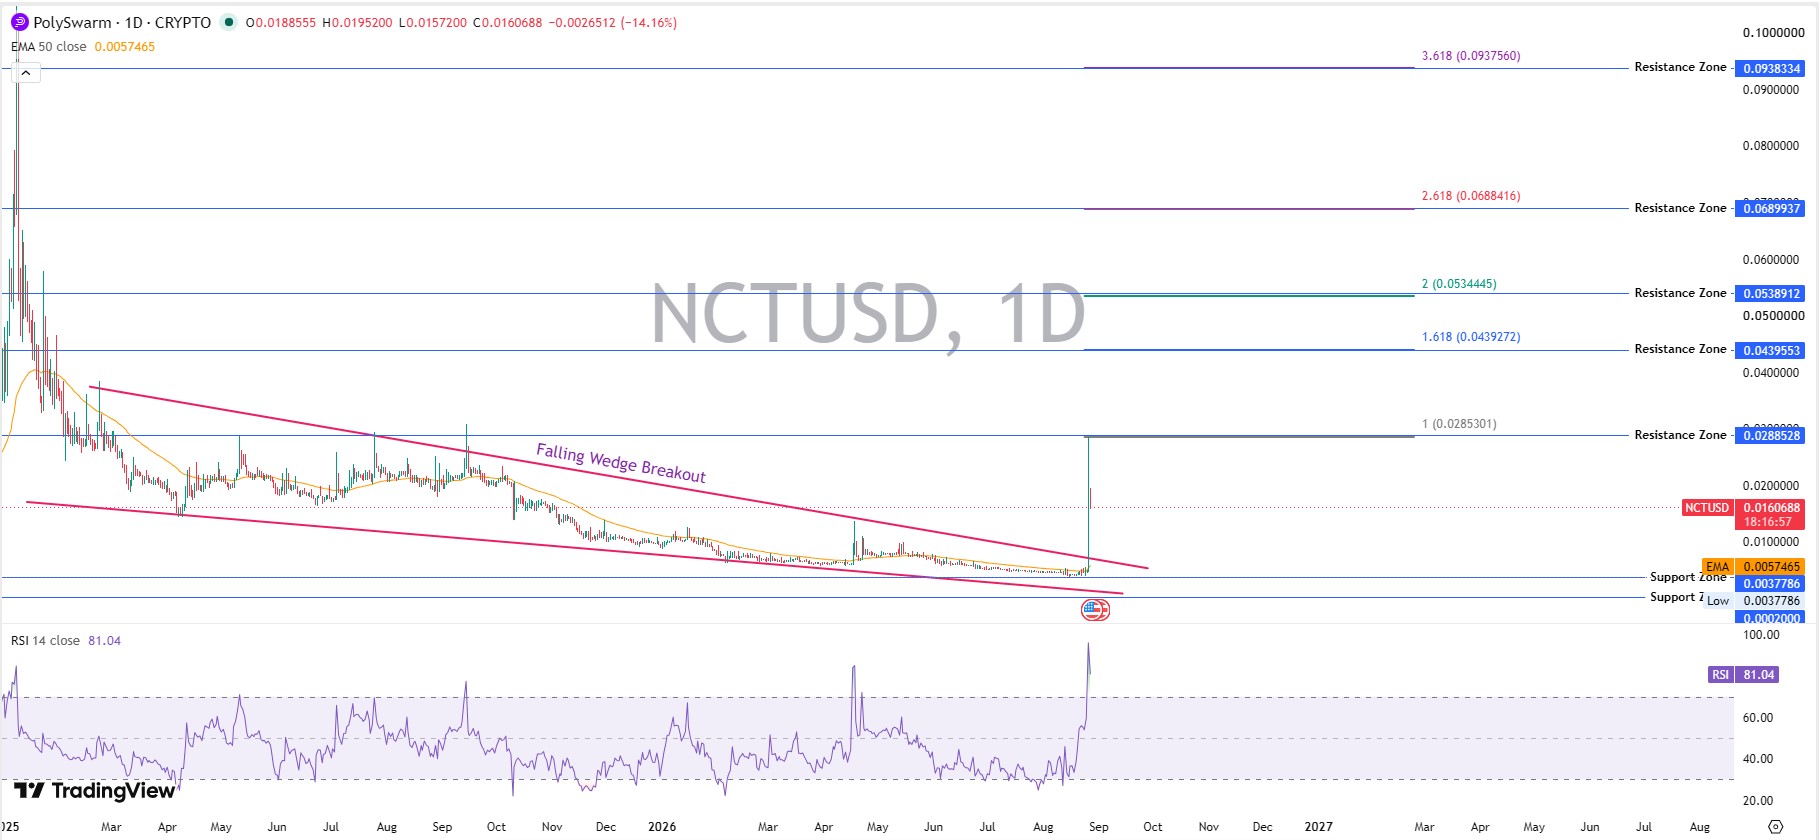
RSI on the daily reads 81.04, deep into overbought territory, per the same chart reading. That doesn't guarantee a pullback, but it does raise the odds of one.
Immediate resistance sits near $0.0288, based on Fibonacci extension mapping from the prior swing. Above that, $0.0439 and $0.0538 stand out as the next hurdles if bullish momentum extends.
On the downside, the EMA50 near $0.00575 marks a support shelf, with a deeper support zone around $0.00378. A retreat toward the wedge breakout line would not undo the larger structural shift.
Trading volume confirms the move rather than contradicting it, which matters more than the price candle alone.
Ethereum Daily Chart Analysis
Ethereum's own chart tells a separate story, and it deserves its own look rather than a passing mention.
The daily structure shows a clean descending channel breakout, based on Ethereum chart data on the daily timeframe. ETH spent months sliding lower inside a falling channel before pushing above the upper boundary on rising trading volume.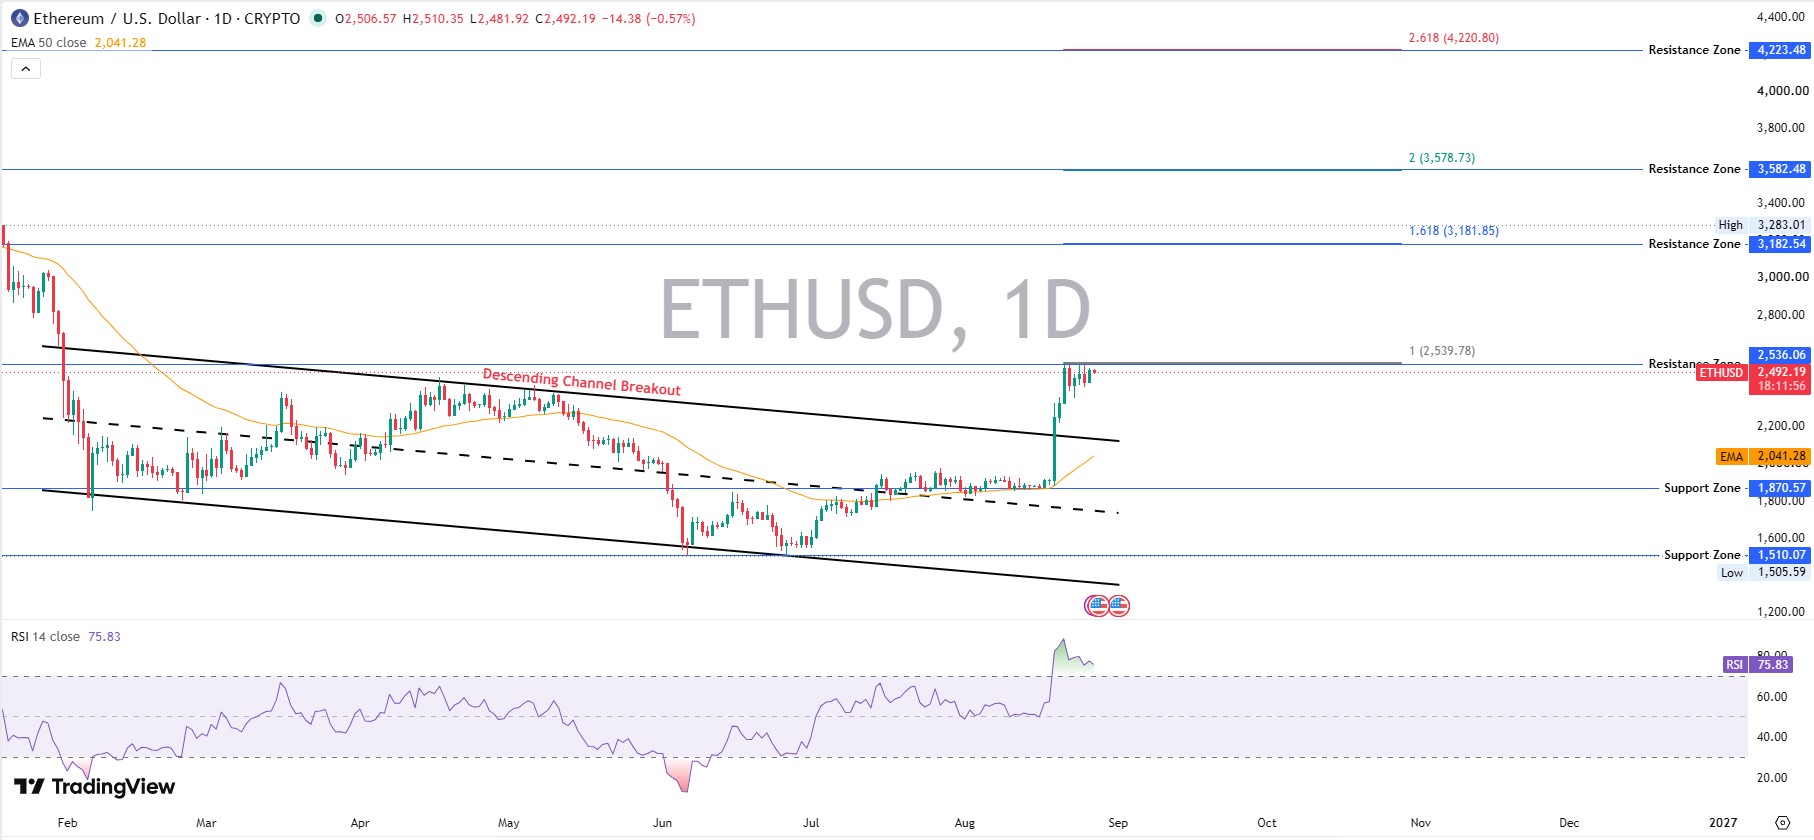
RSI on the daily reads 75.83, overbought but not extreme by Ethereum's own historical standards during strong trend phases.
Immediate resistance sits at $2,536, the first Fibonacci extension level from the prior swing low. Above that, $3,182 and $3,582 mark the next major hurdles, with $4,223 as a far upside extension.
On the support side, the EMA50 near $2,041 has acted as a floor through the recent climb. A deeper support band near $1,870 lines up with the old channel resistance, now flipped to support, a classic sign a bullish reversal has real structure behind it.
Trades on the day ranged between $2,481.92 and $2,510.35, a tight band that suggests consolidation rather than exhaustion after the recent push.
Unlike NCT's wedge breakout, this pattern formed over months, not hours. That difference matters when judging how much conviction sits behind each move.
Whale Concentration: The Risk Behind the Rally
Turns out, the token's ownership structure carries real weight here. On-chain holder data from Etherscan shows the top 10 wallets hold 89.95% of supply, and just five addresses control roughly half the entire token count.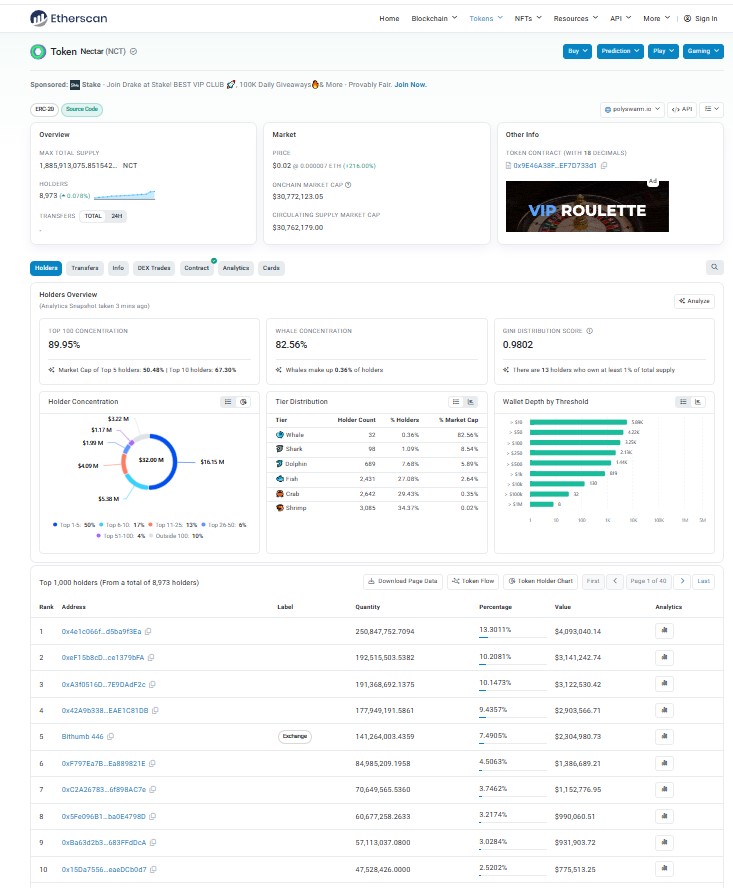
That is an extremely concentrated distribution. A Gini score of 0.98 confirms it, a figure closer to total concentration than to a broad, organic holder base.
Whale wallets alone make up 82.56% of holdings despite being a sliver of total addresses, per Etherscan. When a handful of wallets can move price this easily, sharp reversals become part of the deal, a risk pattern outlined in past coverage of token distribution risks across low-cap projects.
This isn't a reason to panic. It's a reason to size positions with that concentration risk in mind, something any crypto news reader tracking low-cap tokens already knows too well.
PolySwarm vs Ethereum: Comparing the Two Price Stories
Here's where the PolySwarm price prediction picture gets more interesting. Ethereum is not pumping 200%. It's doing something steadier and, arguably, more durable.
ETH trades near $2,493, up about 1.2% in 24 hours, with a market cap of $300.9B, according to CoinMarketCap. Its chart is bullish too, but on a base of real institutional flow, a point worth unpacking on its own further down.
That flow is visible in ETF inflow data.
Spot Ethereum ETFs pulled in $192.35M in a single day, pushing cumulative net assets past $15B, led by BlackRock's ETHA fund, per SoSoValue.
Ethereum also added a fresh use case this week. The network's own account welcomed Revolut's new euro-pegged stablecoin in an official Ethereum update, framing it as a step toward broader access to locally denominated digital money worldwide.
So the comparison is really this: NCT's move is retail-driven and listing-triggered. ETH's move is flow-driven and structural, a distinction covered further in this Ethereum price outlook. Both charts look bullish. Only one has $192M a day behind it.
Altcoin Market Context: Does the Rally Have Legs?
NCT is firmly an altcoin, and altcoin rallies built on a single listing catalyst tend to fade once the initial buyers take profit, a pattern seen often across the meme token trends space too.
Liquidation data across the broader market backs up that caution. According to CoinGlass, Ethereum alone saw $64.41M in 24-hour liquidations, split between longs and shorts, a sign leverage is already stretched across crypto broadly, not just in this one token.
Smaller altcoins with thin holder bases, like NCT, typically see sharper drawdowns than large caps once momentum traders exit. That's simply how low-liquidity tokens behave, and broader geopolitical risk events can make those drawdowns sharper still.
Will this one be different? Hard to say yet.
Price Prediction: Bear, Base, and Bull Scenarios
Timeframe | Bear Case | Base Case | Bull Case | Probability | Invalidation |
7 Days | $0.0075 | $0.0145 | $0.0225 | Bear 35% / Base 45% / Bull 20% | Trades below $0.0057 EMA50 support |
30 Days | $0.0045 | $0.0180 | $0.0440 | Bear 30% / Base 40% / Bull 30% | Sustained trades under $0.0038 support zone |
Early 2027 | $0.0030 | $0.0290 | $0.0690 | Bear 25% / Base 40% / Bull 35% | Loss of Upbit-driven volume and holder growth |
What Could Invalidate This Forecast?
A few things could flip this thesis fast. If volume dries up within days of the Upbit listing, the breakout risks becoming a fakeout.
A drop under the EMA50 support near $0.0057 would undercut the bullish wedge story entirely.
And if any of the top wallets holding roughly half of the supply begin distributing into strength, expect a sharper drawdown than the chart alone suggests.
On the Ethereum side, a reversal in ETF flows or a slowdown in stablecoin adoption on the network would weaken the comparison case made here, and broader regulatory developments could shift sentiment for both assets at once.
Final Take: PolySwarm Price Prediction September 2026
PolySwarm price prediction setups like this one tend to invite excitement first and questions later. The Upbit listing is real, the volume is real, and the falling wedge breakout on the daily chart is real too.
But concentration risk sits right underneath all of it. Ethereum, by comparison, is climbing on steadier ground, backed by ETF demand and expanding real-world use.
Two very different rallies, one week, one crypto market. Traders watching Bitcoin alongside both charts, or scanning the wider AI crypto sector that PolySwarm's threat-detection network touches, should weigh conviction against the size of each position.
Disclaimer
This article is for informational purposes only and does not constitute financial, investment, or trading advice. Cryptocurrency markets are highly volatile, and prices can change rapidly. Always conduct independent research and consult a licensed financial advisor before making any investment decisions. Data referenced here is sourced from CoinMarketCap, CoinGlass, Etherscan, SoSoValue, TradingView, and public social posts as of the timestamps noted and may have changed since publication.

















